Indicator
Breakout
XAUUSD
Forex
EURUSD
BTCUSD
McDonalds Pattern-Bzier Curve
"McDonalds Pattern-Bzier Curve" logo
18/09/2025
16
Desktop
Since 03/10/2024
Sales
102
Free installs
15427
"McDonalds Pattern-Bzier Curve" uploaded image"McDonalds Pattern-Bzier Curve" uploaded image"McDonalds Pattern-Bzier Curve" uploaded image

🚀 10,000+ traders already use our TOP indicators🏆

Discover why professionals choose us – the most powerful tools on cTrader (indicators, algorithms, and cBots) are waiting for you.

👉 Get all our TOP systems here:

_______________________________________________

📌 Market Structure Indicators

·     ✅ AdvancedMarket Structure: Bos, Choch, SwinLevels, Order Blocks,  Market Structure& Liquidity Finder

·     🔄 Dynamic Market StructureAnalysis of Turning Points

·     🧱 Order Block

·     ⚖️ Market Imbalance

·     ⛓️ BOS & CHOCH

·     🧠 ICT Power of 3

·     🌀 Market Polarity Zones

_______________________________________________

🔚 Smart Exit Systems

·     📍 Trailing Smart Algorithm

_______________________________________________

📐 ZigZag Indicators

·     🔍 ZigZag Price LiquidityProjection

·     🧭 S&R Structural ZigZag

·     ➖ ZigZag

·     🎯 Zig-Zag Extremity Tracker

_______________________________________________

🧱 Support & Resistance Indicators

·     🟩 SmartTrend Support &Resistance Lines

·     🧱 All Support and ResistanceLevels

_______________________________________________

📊 Trend & Channel Indicators

·     🔄 Auto-Trend Channel

·     📊 Supertrend

·     ⚡Momentum Trend Analyzer

·     🧠 Adaptive Trend Channel

·     💥 Channel Breakout System

·     🌈 Dynamic Trend Gradient

·     ⭐ PREMIUM SSL CHANNEL

·     🔁 Reactive Moving Average

_______________________________________________

💧 Volume & Liquidity Tools

·     🔥 Volume POC Heatmap

·     📉 Leverage Liquidation Map

·     🔍 Momentum Fair Value Gap

·     🕒 Fair Value Gap Sessions

_______________________________________________

Momentum & RSI Indicators

·     📈 RSI Trend Trigger

·     🚀 Dynamic Range Momentum

·     🔎 Multi-Level Candle Bias
Tracker

_______________________________________________

🔮 Prediction & Projection Tools

·     📐 Prediction Based on Linreg& ATR

·     📏 Fibonacci Linear RegressionMulti-timeframe

·     📈 Volume-Powered Market Flow Projector

________________________________________________________________________________________________________

________________________________________________________________________________________________________

McDonalds Pattern Bézier Curve 🍟

What is it for? 🤔
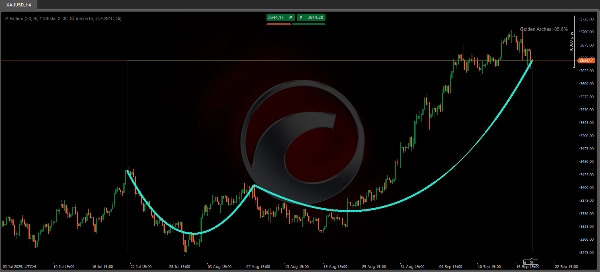
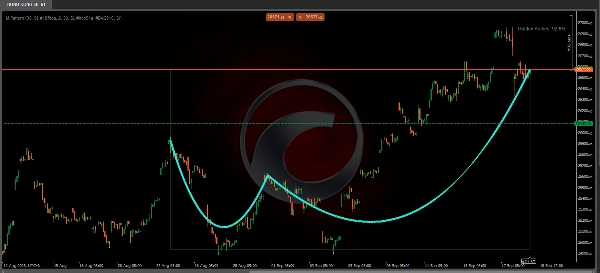
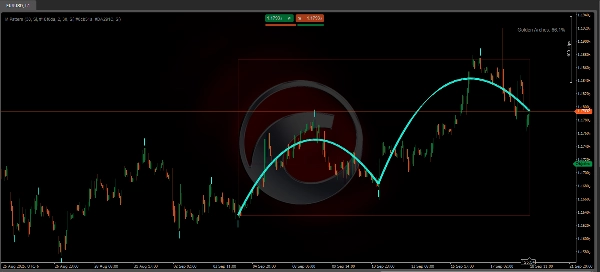
The "McDonalds Pattern Bézier Curve" indicator is designed to identify and visualize price reversal patterns using Bézier curves. Its main objective is to detect market structures that resemble arcs (similar to an "M" or "W") on the charts, which could indicate potential trend changes 🎯. Additionally, it includes a scoring system to evaluate the quality of the detected pattern.

How does it work? ⚙️

  1. Pivot Detection:
    The indicator analyzes a lookback period (defined by "Lookback Period") to identify local highs and lows (pivots). These are marked with circles on the chart: ⚪
  2. Bézier Curves:
    Once at least 5 pivots are detected, the indicator draws two arcs using Bézier curves that connect these points. These arcs aim to smooth the transition between pivots to form a visual structure similar to twin arches ("Golden Arches") 🏛️.
  3. Colored Zone:
    If enabled, an area is drawn between the first and last pivot. The color of this zone depends on the pattern's direction:
    • 🟢 Green: Bullish trend (if the last pivot is higher).
    • 🔴 Red: Bearish trend (if the last pivot is lower).
  4. Pattern Score:
    It calculates a percentage that reflects the symmetry and quality of the arcs. A higher score suggests a better-defined pattern.

Is it repainting (Replotting)? 🔄
Yes, this indicator repaints. This means its drawings and detections can change retroactively as new price data is obtained. This is because the identification of those inflection points is based on observing a certain number of bars after the formation of the potential pivot. Therefore, what seems like a confirmed arc in historical data could be adjusted or disappear when applied to live charts 📊.

It could be used as complementary aid in technical analysis.

How could it be used? 💡

  • 📚 Backtesting Analysis:
    Useful for studying historical patterns and evaluating their effectiveness on different assets or timeframes.
  • 👁️ Visual Confirmation:
    Can complement other analysis tools (like support/resistance or moving averages) to validate potential reversals.
  • 🎓 Education:
    Helps in recognizing market structures based on Bézier curves, although its use in live trading requires additional verification.

Limitations and Recommendations ⚠️

  • Real-Time Use:
    Since it repaints, it should not be used as an independent signal for market entries or exits.
  • Optimization:
    Adjust the "Lookback Period" according to the asset and timeframe to reduce false signals.
  • Market Context:
    Works best in trending markets and not in sideways/ranging markets.

Important Note: 🚨
Given its reliance on future data for confirmation, it should be used primarily for analyzing already occurred events, such as post-market-open declines or educational chart exercises, rather than for predictive or live trading purposes. Although its approach is innovative, it must be used alongside other indicators and analysis to avoid false signals due to its repainting nature. It is ideal for backtesting studies or as an educational complement in trading strategies.

More from this author
Indicator
RSI
Breakout
XAUUSD
+6
ZigZag
ZigZag filters noise, spots trends, patterns, pivots, aiding analysis, trade management, and confirmations. 📉📈
Indicator
RSI
Breakout
XAUUSD
+6
Order Block
Identify bullish and bearish Order Blocks to spot key support/resistance levels and potential trend reversals! 📈🔄
Indicator
RSI
Breakout
XAUUSD
+5
Auto-Trend Channel
Adaptive trend channel using linear regression and Pearson correlation for dynamic support, resistance, and trends.
Indicator
RSI
XAUUSD
Breakout
+5
BOS & CHOCH
Market structural patterns , specifically the concepts of Change of Character (ChoCH) 🔄 and Break of Structure (BoS) 💥
Indicator
RSI
Breakout
XAUUSD
+5
Zones Supply Demand
📊Zones Supply & Demand: Identifies key price levels with high volume concentration, marking Supply/Demand Zones & Marke
Indicator
RSI
Breakout
XAUUSD
+5
Supertrend
💹 Define a price channel 📈 and determine trend direction (bullish 🟢 or bearish 🔴).
Indicator
RSI
Breakout
XAUUSD
+6
Volume POC Heatmap
📊 Shows volume by price levels, highlights POC, and key zones. Identifies dynamic support/resistance and imbalances.
Indicator
RSI
Breakout
Supertrend
All Support and Resistance Levels
"Identify key market zones and visualize support/resistance from multiple timeframes on a single chart.
Indicator
RSI
Breakout
XAUUSD
+6
Fair Value Gap Sessions
identify and highlight temporary market inefficiencies known as "fair value gaps" 🚨 within specific trading Sessions.
Indicator
RSI
Breakout
XAUUSD
+4
Dynamic Market Structure Analysis of Turning Points
Identify market structure effortlessly with swing highs, lows, CHoCH, and BOS levels for smart trading decisions! 📊🔍"
Indicator
Indices
RSI
XAUUSD
+7
RSI Divergence
Detects bullish and bearish divergences
Indicator
RSI
Breakout
Supertrend
Trend Heikin Multi MA
🚀 TrendHeikinMultiMA: Advanced trend detection using Heikin-Ashi smoothing & MAs! Eliminates noise, confirms real trend
Indicator
RSI
Breakout
XAUUSD
+4
Multi-Level Candle Bias Tracker
Price direction by calculating the probability of reaching new highs/lows. Shows levels & stats📈
Indicator
RSI
Breakout
Supertrend
Leverage Liquidation Map
📊 Liquidation Map: Potential areas where highly leveraged investors might face liquidations.
Indicator
RSI
Breakout
Supertrend
Market Trend OB
Price action to detect when the market changes trend (MSB) and defines, order blocks , ZigZag etc.📊
Advanced Market Structure Bos,Choch,SwinLevels, Order Blog
Advanced price action tool that combines multiple technical analysis concepts
Indicator
RSI
Breakout
Supertrend
+3
Fibonacci Linear Regression Multi-timeframe
Combining Fibonacci levels and regression to analyze multidimensional market trends across multiple timeframes¡
Indicator
RSI
Breakout
Supertrend
Zig-Zag Extremity Tracker
Dynamically adjusts regression channels based on ZigZag extremes, resetting when price breaks bands to track real trends
You may also like
Indicator
NAS100
NZDUSD
XAUUSD
+11
Samurai Breakout Lite
⚔️Limited version. Draws clean session box (Tokyo / London / New York / Overlap) and optional breakout plan (EP/TP/SL)⚔️
Indicator
Indices
Prop
Stocks
+5
New Way Sar - Free
The Parabolic SAR, or "Stop and Reverse," is a dynamic technical analysis tool
Precio Promedio Ponderado por Volumen
VWAP (Volume Weighted Average Price, Precio Promedio Ponderado por Volumen)
TDI_Pro
Traders Dynamic Index (TDI) — Divergence Edition
DMG Indicator POSIZIONE APERTE e Prezzi ,SU GRAFICO
Visualizzazione delle Posizioni dei simboli attivi su grafico
Indicator
Signal
Scalping
Nadaraya-Watson Indicator
Indicator
RSI
XAUUSD
Breakout
+6
Market Imbalance
Identifies market imbalances and visually marks key areas based on price patterns and volatility (ATR).
Indicator
Signal
FAMA-MAMA
The FAMA-MAMA Indicator is a powerful, adaptive trend-following tool designed for professional and algorithmic traders.
Indicator
RSI
XAUUSD
Breakout
+5
Prime Trend Targets
PrimeTrend: ATR trendline detects reversals, plots entry/SL/3 targets. Tune params (speed vs. robustness). Backtest +
Indicator
NAS100
NZDUSD
RSI
+12
TrendFibonacci
The TrendFibonacci indicator is a powerful tool for traders, combining Fibonacci retracement levels
IR Macd on Chart
this indicator show macd on chart.
Moving Average channel
This indicator is designed to display customizable moving averages (MAs) on a chart.
Side Volume Profile
Right-anchored cTrader Volume Profile with VAH/VAL/POC, LVZ, top volume+EMA, themes, and fast, readable visuals.
Indicator
Stocks
Forex
Crypto
Trend Angle Indicator [Iridio Capital]
The Trend Angle Indicator provides a clear and intuitive way to visualize market trends.
Indicator
RSI
Breakout
XAUUSD
+6
Order Block
Identify bullish and bearish Order Blocks to spot key support/resistance levels and potential trend reversals! 📈🔄
Indicator
RSI
EURUSD
MACD
Supply&Demand
Precision Supply & Demand zones indicator—automatically plots key buy/sell areas on your chart for smarter entries.
Candles_Painter
Overlay HTF context on any chart: color bars by HTF and draw filled HTF bodies with optional High/Low lines.
NNFX TP AND SL V1.1
A lightweight cTrader indicator that overlays ATR-based SL and TP levels in pips directly on your chart