
Opis
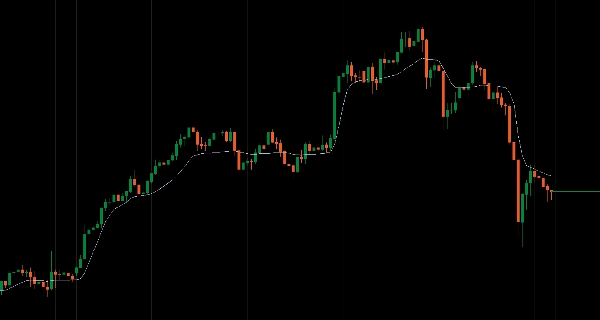
Momentum-adaptive MA, który dynamicznie dostosowuje responsywność na podstawie znormalizowanego odchylenia ceny.
Alpha dostosowuje się na podstawie siły odchylenia, a nie stałych okresów, stając się szybka i reaktywna podczas trendów, pozostając jednocześnie gładka i stabilna podczas konsolidacji z reakcją na wybicie bez opóźnień.
Filtr SuperSmoother 2-biegunowy eliminujący szumy, normalizacja RMS zapewniająca spójne zachowanie w różnych reżimach zmienności, inteligentne obsługiwanie wczesnych świec z zapasowym EMA dla stabilnej inicjalizacji, automatyczne obliczanie alpha (zakres 0,001-0,999) oraz konfiguracja pojedynczego parametru okresu dostarczają adaptacyjne śledzenie trendu dla traderów potrzebujących responsywności na rynkach kierunkowych bez fałszywych sygnałów podczas konsolidacji.
CECHY
Obliczenia adaptacyjne do momentum
- Alpha dostosowuje się dynamicznie na podstawie znormalizowanego odchylenia ceny, a nie stałych okresów
- Staje się szybka i reaktywna podczas silnych trendów
- Gładka i stabilna podczas konsolidacji
- Brak opóźnień przy wybiciach: reaguje natychmiast, gdy cena wykazuje prawdziwe przekonanie kierunkowe
Filtracja SuperSmoother
- Zaawansowany filtr 2-biegunowy eliminuje szumy, zachowując prawdziwe sygnały momentum
- Czysta identyfikacja trendu bez wysokoczęstotliwościowych fałszywych sygnałów
- Utrzymuje integralność sygnału w różnych warunkach rynkowych
Normalizacja RMS
- Odchylenie skalowane przez średnią kwadratową (Root Mean Square)
- Zapewnia spójne zachowanie w różnych reżimach zmienności
- Automatycznie dostosowuje się do różnych warunków rynkowych
Inteligentna obsługa wczesnych świec
- Przechodzi na prosty EMA podczas okresu rozruchu dla stabilnej inicjalizacji
- Niezawodna stabilność z wbudowaną ochroną przed NaN/∞
- Rzetelne obliczenia od pierwszej świecy
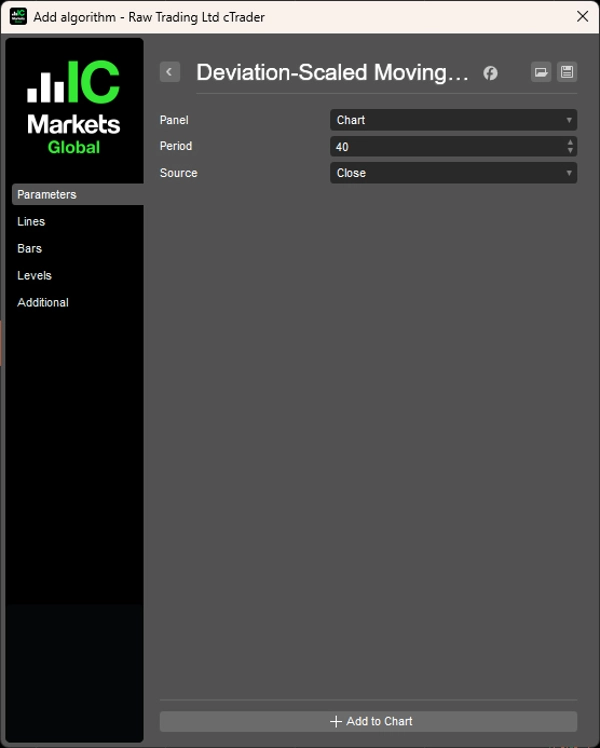
Prosta konfiguracja
- Pojedynczy parametr okresu (domyślnie 40)
- Automatyczne obliczanie alpha (zakres od 0,001 do 0.999)
- Indykator nakładkowy — wykres bezpośrednio na wykresie cenowym
- Brak skomplikowanych ustawień
__________________________________________________________________________________________
WIĘCEJ DARMOWYCH INDIKATORÓW
Odkryj szeroki zakres narzędzi analizy rynku — od struktury i wolumenu po regresję, zmienność i niestandardowe ramy czasowe.
Kod źródłowy jest dostępny w repozytorium GitHub repository.
Wszystko dostępne za darmo. Ale jeśli chcesz wesprzeć kawą, możesz to zrobić tutaj.
Wsparcie/Oporność
Wolumen
- Volume Activity Profiler
- Volume Efficiency Analyzer
- Volume Profile Analytics
- Volume Profile - Updated
- Volume Spread Analysis
- VWAP (Volume Weighted Average Price)
Średnie kroczące
- SSL Channel
- Anchored Moving Average
- Deviation-Scaled Moving Average
- Gann High Low Activator
- Instantaneous Trendline
- Kaufman Adaptive MA with Trend Vision
- Moving Average Channel
- Moving Averages Suite
- Trend Channel Moving Average
Narzędzia/Niestandardowe
Oparte na regresji
Zmienność
Oscylatory
__________________________________________________________________________________________
ZASTRZEŻENIE
Trading wiąże się z ryzykiem. Ten wskaźnik jest przeznaczony wyłącznie do analizy technicznej — zawsze stosuj odpowiednie zarządzanie ryzykiem i handluj odpowiedzialnie.
OPINIE I ULEPSZENIA
Jeśli masz sugestie, prośby o funkcje lub pomysły na ulepszenia, zostaw komentarz na karcie Dyskusja. Twoja opinia pomaga ulepszyć wskaźnik dla wszystkich.
Podsumowanie
Opinie klientów
5 | 100 % | |
4 | 0 % | |
3 | 0 % | |
2 | 0 % | |
1 | 0 % |


