
ChoppinessIndex
Индикатор
99 скачивания
Версия 1.0, Mar 2026
Windows, Mac
Описание
Как это работает
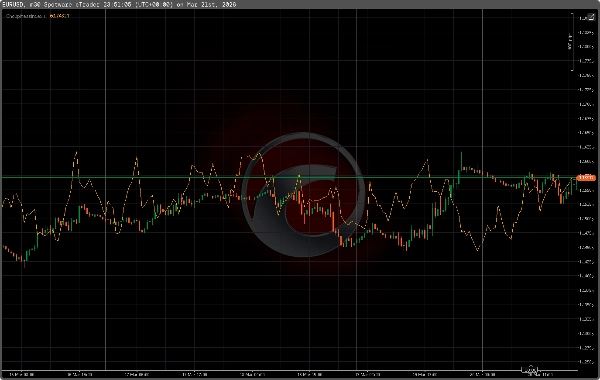
- Период: по умолчанию 14. Индикатор вычисляет отношение суммы диапазонов high–low за период к истинному диапазону за тот же период, затем масштабирует результат с помощью логарифмической формулы: choppiness = 100 * log10(sum(Range) / TrueRange) / log10(Period)
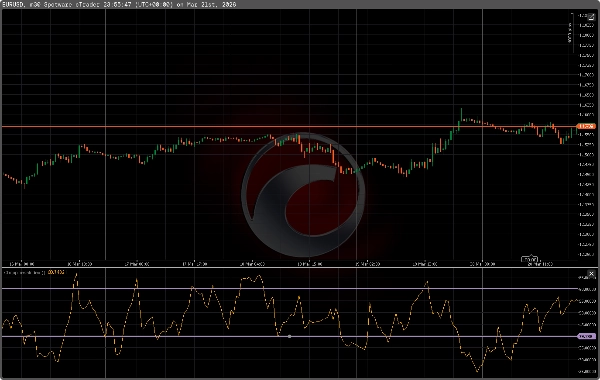
- Вывод: одна линия с меткой "CMI" (по умолчанию оранжевая), где:
-
- Высокие значения = рынок флетовый/боковой (избегайте направленных сделок или ждите подтверждения пробоя)
- Низкие значения = рынок трендовый (ищите возможности следования за трендом)
Интерпретация и типичные настройки
- Период по умолчанию: 14 (настраивается в диапазоне 7–28 в зависимости от таймфрейма и рынка).
- Распространённые пороговые значения (рекомендуемые, регулируемые):
-
- Выше ~61.8 → сильно флетовый / боковой рынок
- 38.2–61.8 → смешанный / консолидация
- Ниже ~38.2 → трендовый рынок (сильное направленное движение)
- Таймфреймы:
-
- Используйте более высокие таймфреймы (H1, H4, Daily) для подтверждения тренда и свинг-трейдов.
- Используйте более низкие таймфреймы (M5–M30) с уменьшенным периодом для скальпинговых настроек.
- Рынки: работает на Forex, золоте/серебре (XAUUSD/XAGUSD), индексах и криптовалютах. Производительность зависит от профиля волатильности инструмента.
Как использовать в стратегии
- Фильтр пробоя: входите в сделки на пробой только когда CMI ниже вашего порога тренда (например, <38).
- Подтверждение тренда: комбинируйте с индикатором тренда (скользящие средние, Supertrend) и/или индикаторами момента (MACD, RSI) — входите в сделки, когда и тренд/моментум подтверждают, и CMI указывает на трендовую среду.
- Избегайте шума сигналов: когда CMI выше порога флетовости (например, >61), откладывайте направленные сделки или ужесточайте стопы.
- Сочетание с волатильностью: используйте ATR или полосы Боллинджера для оценки риска и подтверждения режимов волатильности.
Дополнительные индикаторы
- ADX (сила тренда), ATR (волатильность), MACD / RSI (моментум), Supertrend или скользящие средние (направление тренда), полосы Боллинджера (диапазон/волатильность).
Установка и параметры
- Параметр: Период (по умолчанию 14).
- Имя вывода: CMI (оранжевый).
- Без перерисовки: значения вычисляются на завершённых барах; используйте обычное управление рисками и подтверждения.
Предупреждение о рисках Этот индикатор предоставляет информационные сигналы для поддержки принятия решений. Он не является самостоятельной торговой системой. Тестируйте и проверяйте настройки для ваших инструментов и таймфреймов. Всегда используйте правильное управление рисками и капиталом.
Сводка
ИИ-сводка
The Choppiness Index (CMI) is a technical indicator designed to distinguish trending markets from ranging (choppy) markets, aiding traders in filtering breakout signals and improving trend-following entries. It calculates the ratio of the sum of high–low price ranges over a specified period (default 14) to the true range, then applies a logarithmic scale to produce a single output line labeled "CMI."
Key functionality includes:
- High CMI values indicate a choppy or range-bound market, suggesting caution with directional trades or waiting for breakout confirmation.
- Low CMI values signal trending markets, highlighting opportunities for trend-following strategies.
- Adjustable period settings (7–28) allow tuning based on timeframe and market conditions.
- Suggested thresholds: above ~61.8 for choppy markets, 38.2–61.8 for consolidation, and below ~38.2 for trending conditions.
- Suitable for multiple markets including Forex, commodities (gold, silver), indices, cryptocurrencies, and stocks.
- Recommended use on higher timeframes (H1, H4, Daily) for trend confirmation and swing trading, and on lower timeframes (M5–M30) with shorter periods for scalping.
- Can be combined with other indicators such as ADX, ATR, MACD, RSI, Supertrend, and Bollinger Bands for enhanced strategy development.
- Non-repainting values are calculated on completed bars to support reliable analysis.
This indicator serves as an informational tool to support trading decisions and should be used alongside proper risk management and complementary indicators.
Профиль индикатора
Отзывы покупателей
0.0
Отзывы: 0
Отзывы покупателей
У этого продукта еще нет отзывов. Уже попробовали его? Поделитесь впечатлениями!
Обсуждение
Частые вопросы
Forex
Signal
Breakout
Scalping
Indices
Commodities
Crypto
Stocks
Продукты, доступные в cTrader Store, включая торговых ботов, индикаторы и плагины, предоставляются сторонними разработчиками и доступны исключительно в информационных и технических целях. cTrader Store не является брокером и не предоставляет инвестиционные консультации, персональные рекомендации или какие-либо гарантии будущей доходности.
Больше от этого автора


Цена
С 16/01/2025
2.73M
Торгуемый объем
1.98K
Выигранные пипы
283
Бесплатные установки