
Описание
Pinescritlabs
Индикаторы Ctrader Store: 🤖cBots Pinescritlabs Ctrader Store:
Fair Value Gap Sessions Gold & BTC Breakout Session Pivots
Dynamic Market Structure
Анализ поворотных точек
Fibonacci Linear
Регрессия на нескольких таймфреймах
Multi-Level Candle Bias
Трекер
Auto Support and
Resistance Trend Lines
All Support and
Resistance Levels
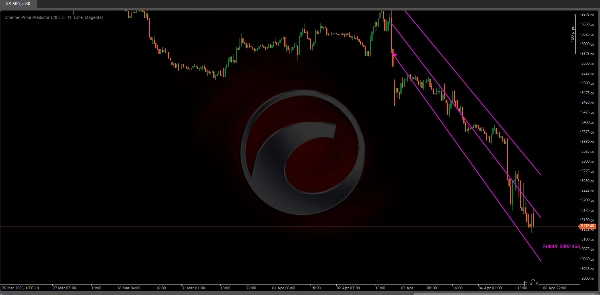
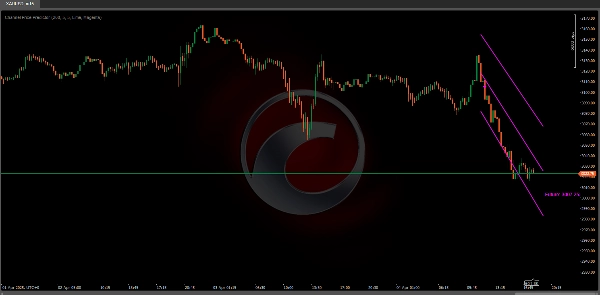
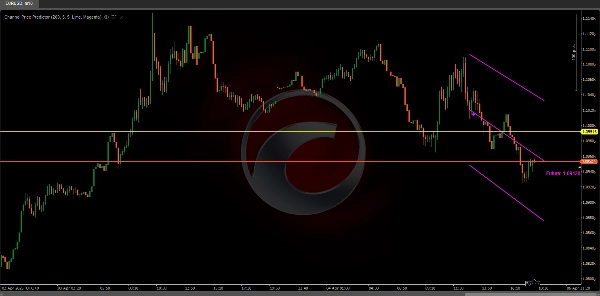
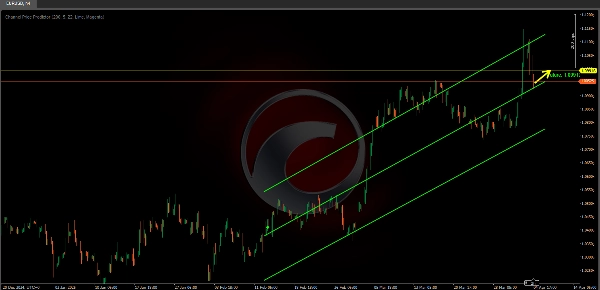
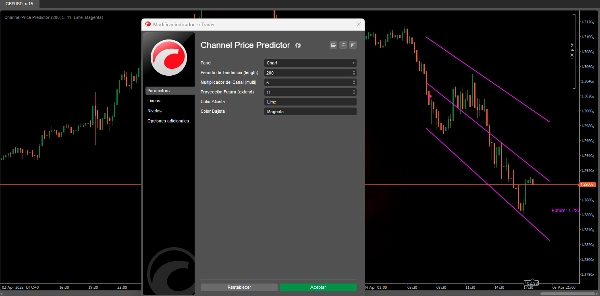
Прогнозатор цены канала определяет и рисует трендовый канал (либо бычий, либо медвежий) на графике, продолжая его в будущее для прогнозирования возможных ценовых зон. 📈🔮
Канал основан на ATR (Average True Range), который измеряет волатильность рынка. Чем выше недавняя волатильность, тем шире канал, что помогает визуализировать диапазон вероятных движений. 📊💥
Он автоматически определяет и рисует каналы на основе пивотных максимумов и минимумов.
Возможность продлить линии канала и спрогнозировать их будущую цену. 🕒📉
Этот канал не только показывает текущее движение, но и дает оценочный прогноз цены на будущее через метку (“Future: …”), указывающую возможное значение цены. 📅💡
Для чего это нужно?
Идентификация тренда:
Индикатор использует внутреннюю логику для определения момента, когда рынок переключается с бычьего на медвежий (или наоборот). Таким образом, вы можете яснее видеть, находится ли актив в восходящей или нисходящей фазе. 📈🔄📉
Каналы волатильности:
Канал основан на ATR (Average True Range), который измеряет волатильность. Чем выше недавняя волатильность, тем шире канал. Это помогает видеть диапазон вероятных движений. 📊🔍
Прогноз на будущее:
Индикатор не просто показывает текущий тренд, но и продлевает канал на несколько периодов вперед (настраиваемо), чтобы вы могли предвидеть возможные зоны поддержки/сопротивления в рамках этого тренда. ⏳🚀
Он позволяет продлевать линии канала и прогнозировать их будущую цену. ⬆️⬇️
Ценовые ориентиры:
Рисуя центральную линию и верхние и нижние границы, он дает вам ориентиры для установки стопов, целей или даже для управления входами/выходами с большей информацией о волатильности. 🎯📍
Из-за ограничений cTrader в настоящее время невозможно прокручивать график вправо для корректного просмотра будущих продолжений канала.
Рекомендуется установить параметр “Future Projection” на значение менее 25 периодов, чтобы избежать проблем с отображением.
Как только cTrader реализует возможность расширения графика в будущее, мы внесем улучшения в алгоритм, чтобы полностью использовать эту функцию.
Сводка
Key features include automatic detection of trend direction changes, visualization of current trend channels, and the ability to extend channel lines into the future. This future projection helps anticipate potential support and resistance zones by displaying estimated price values labeled as “Future: …”. The indicator draws a central line along with upper and lower channel boundaries, providing reference points for placing stops, targets, and managing trade entries and exits with volatility context.
Users can configure the number of periods for future projection, with a recommended maximum of 25 periods to avoid display issues due to cTrader platform limitations. The indicator supports analysis of various markets including cryptocurrencies (e.g., BTCUSD), commodities (e.g., XAUUSD), and others where volatility and trend identification are relevant.
Отзывы покупателей
5 | 100 % | |
4 | 0 % | |
3 | 0 % | |
2 | 0 % | |
1 | 0 % |


![Логотип продукта "[Hamster-Coder] Moving Average MTF"](https://cdn.ctrader.com/image/webp/b11b98b1-194d-4b8e-b00e-d611826ad159_31226)


