
Deskripsi
Indikator Toko Pinescriptlabs: 🤖Toko Pinescriptlabs cBots : (cBot)
Gold & BTC BreakoutSession Pivots(baru)
SmartTrend Support &
Resistance
Lines
Dynamic
Market Structure
Analysis
of
Turning Points
Fibonacci
Linear
Regression
Multi-timeframe
Multi-Level
Candle Bias
Tracker
Auto
Support and
Resistance
Trend
Lines
All
Support and
Resistance
Levels
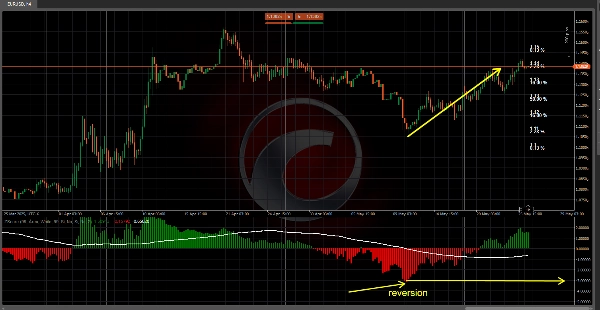
The Z-Score mengubah harga menjadi "skala deviasi standar"
,"menunjukkan seberapa jauh penutupan (atau pembukaan, tertinggi, terendah) setiap candle menyimpang dari rata-rata historisnya. Dengan visual intuitif, ini membantu mengidentifikasi kondisi overbought/oversold
dan zona pembalikan berprobabilitas tinggi! 🔄
1️⃣ Apa Fungsinya?
🔹 Menstandarisasi Harga: Mengubah nilai penutupan absolut menjadi Z-Score—berapa banyak deviasi standar dari rata-rata
dari N bar terakhir.
🔹 Menyoroti
Ekstrem Statistik: Nilai
dekat ±1, ±2, atau ±3 menunjukkan kelangkaan dalam pergerakan harga:
- ±1 SD (≈ 68% probabilitas antara –1 dan 1)
- ±2 SD (≈ 95% probabilitas antara –2 dan 2)
- ±3 SD (≈ 99,7% probabilitas antara –3 dan 3)
🔹 Membantu
dalam Trading Mean Reversion:
Ketika Z-Score melebihi ±2 atau ±3, pasar berada dalam zona ekstrem
dan cenderung berbalik ke rata-rata (nol).
🔹 Visualisasi
yang Jelas: Menggunakan histogram (atau candle khusus), garis moving average, dan zona berwarna, Anda dapat langsung melihat apakah harga berperilaku "normal" atau merupakan
outlier statistik.
2️⃣ Bagaimana Cara Kerjanya?
📐 Perhitungan Rata-rata & Deviasi Standar
- Sebuah
periode lookback (misalnya, 99
bar) digunakan. - Rata-rata
dan deviasi standar (SD) dari
harga penutupan dihitung. - SD lebih tinggi = Volatilitas lebih besar dalam pergerakan harga.
🧮 Rumus Z-Score
Z=Penutupan Saat Ini−Rata-rata HistorisDeviasi StandarZ=Deviasi StandarPenutupan Saat Ini−Rata-rata Historis
- Z Positif → Penutupan di atas rata-rata.
- Z Negatif → Penutupan di bawah rata-rata.
📊 Probabilitas Tabel Z
- Menyoroti kolom Z-Score saat ini untuk menunjukkan seberapa langka/ekstrem harga tersebut!
3️⃣ Cara Menggunakannya dalam Trading
✅ Mean Reversion: Cari Z > +2 atau Z < –2 untuk trading pembalikan (jual ekstrem overbought, beli ekstrem oversold).
✅ Konfirmasi Tren: Z yang bertahan
> 0 + moving average naik menandakan kekuatan;
Z < 0 + MA turun menunjukkan kelemahan.
✅ Manajemen Risiko: Dekat ±1 SD, harapkan pergerakan normal; dekat ±3
SD, sesuaikan stop &
ukuran posisi dengan hati-hati.
✅ Waktu Masuk: Gabungkan Z-Score ekstrem dengan level support/resistance
untuk entri yang tepat.
4️⃣ Kelebihan & Pertimbangan
✔️ Keuntungan
- Keunggulan statistik dalam mendeteksi kondisi harga ekstrem.
- Beberapa mode tampilan (histogram, candle, band, tabel probabilitas).
- Kustomisasi mudah (panjang, warna, tipe grafik).
⚠️ Pertimbangan:
- Dalam tren yang
kuat, harga dapat tetap "ekstrem" untuk periode lama tanpa berbalik. - Mengasumsikan distribusi
normal—mungkin tidak bekerja baik di pasar yang sangat volatil/terdistorsi. - Sebaiknya digunakan di lingkungan volatilitas yang
stabil.
Ringkasan
The indicator calculates the mean and standard deviation of recent closing prices to determine the Z-Score using the formula:
Z = (Current Close − Historical Mean) / Standard Deviation.
Positive Z-Scores indicate prices above the mean, while negative scores indicate prices below it.
ZScore Reversion provides clear visualizations through histograms, special candles, moving averages, and colored zones to distinguish normal price behavior from statistical outliers. It supports mean reversion trading by signaling when prices exceed ±2 or ±3 standard deviations, suggesting a likely return to the mean. It also aids trend confirmation by interpreting sustained positive or negative Z-Scores combined with moving average trends.
Risk management is facilitated by adjusting stops and position sizes near extreme Z-Score values. Entry timing can be refined by combining extreme Z-Scores with support and resistance levels. The indicator offers multiple display modes and customization options for length, colors, and chart types. It is best suited for stable volatility environments and assumes a normal distribution of price data.
Ulasan pelanggan
5 | 100 % | |
4 | 0 % | |
3 | 0 % | |
2 | 0 % | |
1 | 0 % |


