Description
🚀 Plus de 10 000 traders utilisent déjà nos MEILLEURS indicateurs🏆
Découvrez pourquoi les professionnels nous choisissent – les outils les plus puissants sur cTrader (indicateurs, algorithmes et cBots) vous attendent.
👉 Obtenez tous nos systèmes TOP ici :
_______________________________________________
📌 Indicateurs de structure de marché
· ✅ AdvancedMarket Structure : Bos, Choch, SwinLevels, Order Blocks, Market Structure& Liquidity Finder
· 🔄 Analyse dynamique de la structure du marché des points de retournement
· 🧱 Bloc d'ordre
· ⛓️ BOS & CHOCH
· 🧠 ICT Power of 3
· 🌀 Zones de polarité du marché
_______________________________________________
🔚 Systèmes de sortie intelligents
· 📍 Algorithme intelligent de suivi
_______________________________________________
📐 Indicateurs ZigZag
· 🔍 Projection de liquidité des prix ZigZag
· ➖ ZigZag
· 🎯 Suivi des extrémités Zig-Zag
_______________________________________________
🧱 Indicateurs de support et résistance
· 🟩 Lignes de support et résistance SmartTrend
· 🧱 Tous les niveaux de support et résistance
_______________________________________________
📊 Indicateurs de tendance et de canal
· 🔄 Canal de tendance automatique
· 📊 Supertrend
· ⚡Analyseur de tendance Momentum
· 🧠 Canal de tendance adaptatif
· 💥 Système de cassure de canal
· 🌈 Gradient de tendance dynamique
_______________________________________________
💧 Outils de volume et de liquidité
· 🔥 Carte thermique Volume POC
· 📉 Carte de liquidation à effet de levier
· 🕒 Sessions de Fair Value Gap
_______________________________________________
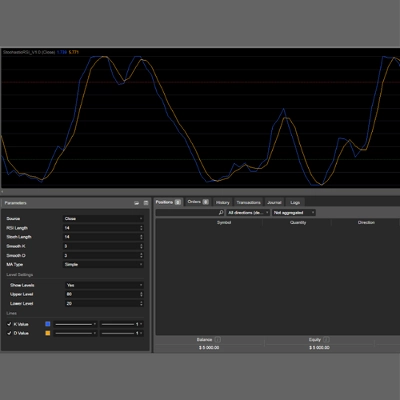
⚡ Indicateurs Momentum & RSI
· 📈 Déclencheur de tendance RSI
· 🚀 Momentum de la plage dynamique
· 🔎 Biais de chandelier multi-niveaux
Suivi
_______________________________________________
🔮 Outils de prédiction et de projection
· 📐 Prédiction basée sur Linreg & ATR
· 📏 Régression linéaire de Fibonacci Multi-timeframe
· 📈 Projecteur de flux de marché alimenté par le volume
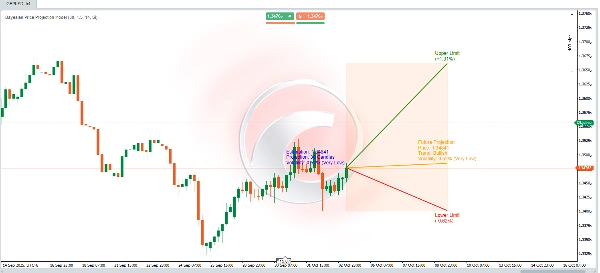
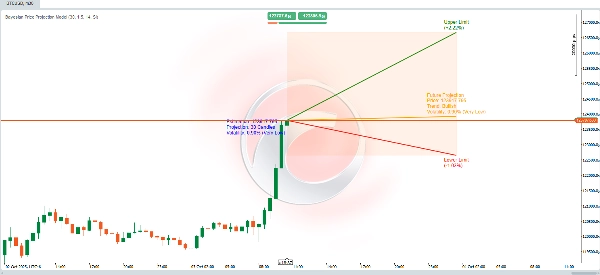
📊 Algorithme dynamique de projection des prix 📈
Cet algorithme combine **calculs statistiques**, **analyse technique** et **théorie bayésienne** pour prévoir un prix futur tout en fournissant des **plages d'incertitude** représentant les limites supérieure et inférieure. Les calculs sont conçus pour ajuster les projections en tenant compte des **tendances** du marché, de la **volatilité** et des probabilités historiques d'atteindre de nouveaux sommets ou creux.
Voici comment cela fonctionne :
🚀 Projection du prix futur
Un calcul dynamique estime le prix futur basé sur trois éléments clés :
1. **Tendance** : Définit si le marché est prédisposé à monter ou descendre.
2. **Volatilité** : Quantifie l'ampleur du changement attendu basé sur les fluctuations historiques.
🧠 **Ajustement probabiliste bayésien**
- Les probabilités conditionnelles sont calculées en utilisant la **formule de Bayes** :
\[
P(A|B) = \frac{P(B|A) \cdot P(A)}{P(B)}
\]
Cela modélise les événements futurs en utilisant des informations conditionnelles :
- **Probabilité d'atteindre un nouveau sommet historique** si le prix est en tendance haussière.
- **Probabilité d'atteindre un nouveau creux historique** si le prix est en tendance baissière.
- Ces probabilités affinent l'estimation du prix futur en considérant :
- **Une volatilité plus élevée** augmente la probabilité d'atteindre des niveaux extrêmes (hauts/bas).
- **Les tendances du marché** influencent la direction attendue du mouvement des prix.
🌟 **Calcul de la volatilité**
- La volatilité est mesurée à l'aide de l'indicateur **ATR (Average True Range)** avec une fenêtre de 14 périodes. Cela reflète l'amplitude moyenne des fluctuations de prix.
- Pour exprimer la volatilité en pourcentage, l'ATR est normalisé en le divisant par le prix de clôture et en le multipliant par 200.
- La volatilité est ensuite catégorisée en niveaux descriptifs (par exemple, **Très faible**, **Faible**, **Modérée**, etc.) pour une meilleure interprétation.
---
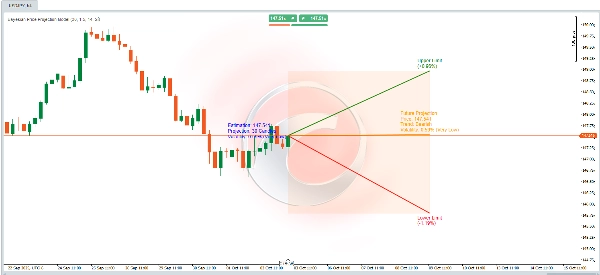
🎯 **Limites de déviation (supérieure et inférieure)**
- Les limites supérieure et inférieure forment une **plage projetée** autour du prix futur estimé, fournissant un cadre pour l'incertitude.
- Ces limites sont calculées en ajustant l'ATR en utilisant :
- Un **multiplicateur** défini par l'utilisateur (`factor_desviacion`).
- Les **probabilités bayésiennes** calculées précédemment.
- La **racine carrée de la période projetée** (`proyeccion_dias`), incorporant le principe que l'incertitude croît avec le temps.
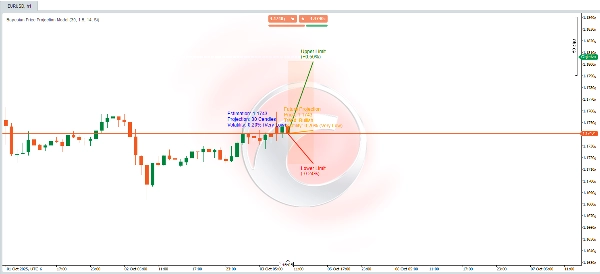
🔍 **Interprétation du modèle**
Cela peut être vu comme un **modèle probabiliste dynamique** qui :
- Combine **analyse technique** (tendances et ATR).
- Affine les probabilités en utilisant la **théorie bayésienne**.
- Fournit une **plage de projection visuelle** pour vous aider à comprendre les mouvements potentiels futurs des prix et les incertitudes associées.
⚡ Que vous analysiez des **marchés volatils** ou confirmiez des scénarios **haussiers/baissiers**, cet outil vous équipe d'une approche robuste et basée sur les données ! 🚀


![Logo de "Gaussian Channel [Iridio Capital]"](https://cdn.ctrader.com/image/webp/7c039209-5573-4a54-a072-f9528b503103_41960)