
AsiaSession
Indicator
225 downloads
Version 1.0, Dec 2025
Windows, Mac
Description
📜 Description
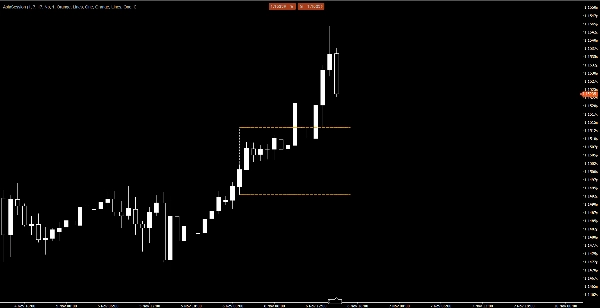
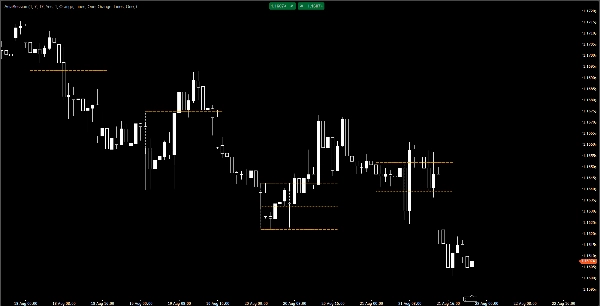
AsiaSession Indicator is a custom tool for the cTrader platform that highlights the Asian trading session range. It draws a complete session box with vertical boundaries for start and end times, and horizontal lines for the high, low, and mid levels. This makes it especially useful for traders applying Smart Money Concepts (SMC) and ICT strategies, where Asia session levels often act as liquidity zones.
✨ Key Features
- Draws a complete session box:
- Left line (session start)
- Right line (session end)
- Top line (Asia high)
- Bottom line (Asia low)
- Mid line (Asia mid)
- Extends high/low/mid lines into the future until a user‑defined time
- Configurable colors, styles, and thickness for each line
- Option to show only the current day or include historical sessions
- Built‑in UTC offset parameter for timezone adjustments
- Automatically skips weekends to avoid false sessions
- Clean, object‑oriented architecture with enums, helpers, models, and services
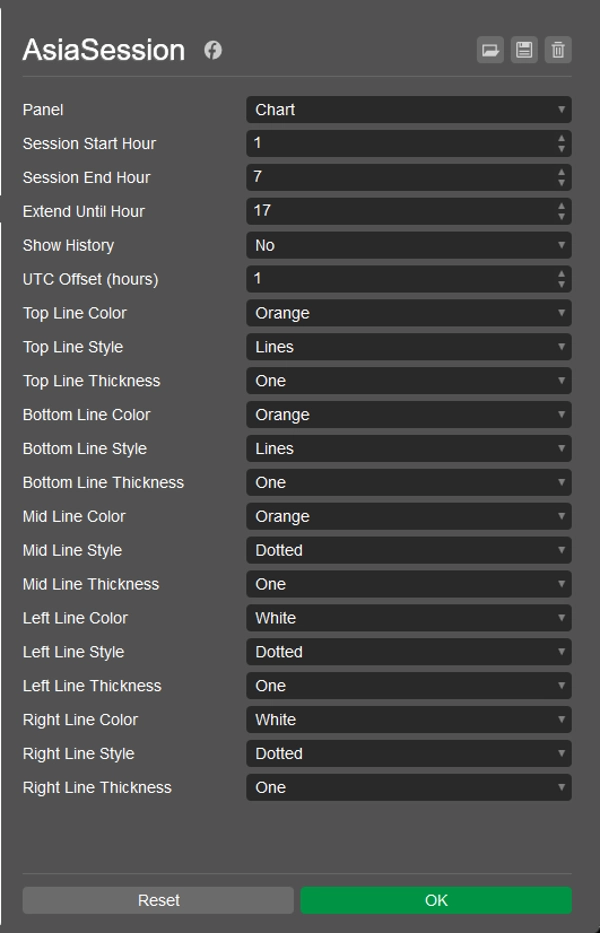
⚙️ Parameters
- Session Start Hour / End Hour – define Asia session boundaries
- Extend Until Hour – control how long lines extend into the future
- Show History – toggle historical session boxes
- UTC Offset – adjust to your local timezone or broker server time
- Line customization – set color, style, and thickness for each boundary
📈 Usage
- Install the indicator in cTrader Automate.
- Attach it to your chart.
- Adjust parameters to match your trading timezone and preferences.
- Enable Show History to visualize past sessions.
📦 License
Published under the MIT License – free to use, modify, and distribute.
Summary
AI summary
AsiaSession is a custom indicator for the cTrader platform designed to visualize the Asian trading session range. It draws a complete session box on the chart, including vertical lines marking the session start and end times, and horizontal lines indicating the session’s high, low, and mid levels. These lines can be extended into the future up to a user-defined time. The indicator supports customizable colors, styles, and thickness for each line, allowing traders to tailor the display to their preferences.
Key parameters include session start and end hours, extension duration for the lines, an option to show historical sessions or only the current day, and a built-in UTC offset for timezone adjustments. The indicator automatically skips weekends to avoid displaying false sessions. Its architecture is object-oriented, facilitating clean and efficient operation.
AsiaSession is particularly useful for traders applying Smart Money Concepts (SMC) and ICT strategies, where Asian session levels often serve as liquidity zones. Installation involves adding the indicator to cTrader Automate and configuring parameters to match the trader’s timezone and preferences. The product is published under the MIT License, permitting free use, modification, and distribution.
Indicator profile
Customer reviews
0.0
Reviews: 0
Customer reviews
No reviews for this product yet. Already tried it? Be the first to tell others!
Discussion
FAQ
Forex
EURUSD
SMC
Products available through cTrader Store, including trading bots, indicators and plugins, are provided by third-party developers and made available for informational and technical access purposes only. cTrader Store is not a broker and does not provide investment advice, personal recommendations or any guarantee of future performance.
More from this author


!["[Stellar Strategies] Inside Bar with Signals" logo](https://cdn.ctrader.com/image/webp/1d9e8bfa-3b2c-4440-bb37-5856902008a7_30683)


Price
Since 24/09/2025
368
Free installs