
Description
A clean, simple, and highly visual indicator that detects crossovers between two Simple Moving Averages (SMA) and displays everything clearly on the chart.
Key Features:
- Large colored arrows right at the exact crossover point → Lime Green ↑ → Bullish crossover (potential buy) → Red ↓ → Bearish crossover (potential sell)
- Permanent status panel in the top-right corner of the chart → Type of the latest crossover (BULLISH / BEARISH / WAITING) → Exact date and time of the crossover → Configured periods of the moving averages
- 100% non-repainting
- Prevents duplicate signals on the same bar
- Prints messages to the log each time a crossover occurs (great for tracking)
- Very lightweight – works perfectly on any timeframe
My favorite way to use it (and the one I recommend):
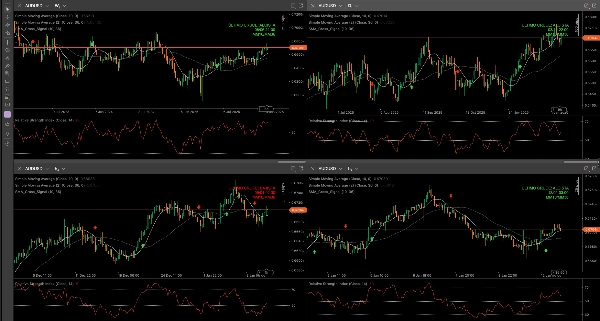
I apply it simultaneously on the Weekly, Daily, H4, and H1 timeframes of the same currency pair.
I mainly take entries on H1, but having the indicator on the higher timeframes gives me a very powerful overall view of the pair's dominant direction:
- Are the bullish/bearish crossovers aligned across Weekly and Daily? → Higher probability
- Conflicting signals between timeframes? → Better to wait or reduce position size
Popular configurations that work well:
- 9 / 21
- 10 / 30
- 21 / 50
- 50 / 200 (especially useful on Weekly and Daily charts)
Perfect for both beginners (thanks to its clear visuals and simplicity) and experienced traders looking for a clean base to combine with Price Action, support/resistance, or volume.
Completely free for the entire cTrader community!
Try it on demo, apply it in multi-timeframe mode, and if you like it… feel free to leave a comment with your favorite settings or the pair where it's working best for you 😊
Happy trading everyone!
Summary
Key features include non-repainting signals, prevention of duplicate alerts on the same bar, and log messages for each crossover event. The indicator is lightweight and compatible with any timeframe, making it suitable for multi-timeframe analysis. Commonly used SMA period pairs include 9/21, 10/30, 21/50, and 50/200, with the latter especially useful on weekly and daily charts.
Traders often apply the indicator simultaneously on weekly, daily, 4-hour, and 1-hour timeframes to gain a comprehensive view of market direction and improve entry timing. It supports various markets including Forex and popular symbols like EURUSD, GBPUSD, USDJPY, XAUUSD, and BTCUSD. The indicator is designed for both beginners and experienced traders seeking clear, straightforward moving average crossover signals.


