
Descripción
Superposición de Spread y Costos de cTrader es un indicador ligero diseñado para visualizar los costos de trading en tiempo real directamente en el gráfico.
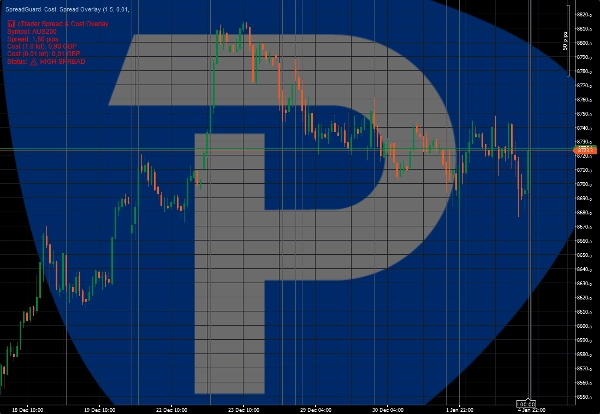
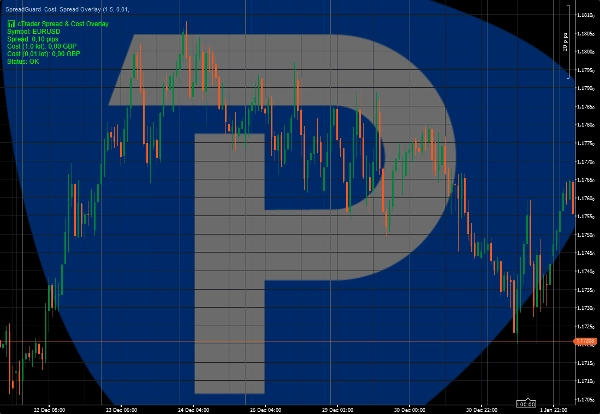
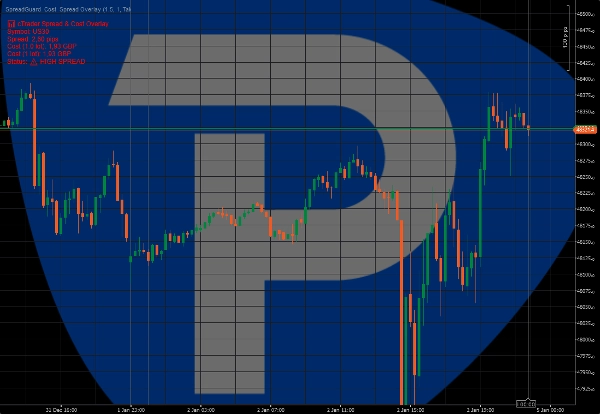
El indicador muestra el spread actual en pips y calcula el costo estimado de una operación basado en el tamaño de lote seleccionado. Una advertencia visual resalta los períodos de spread alto, ayudando a los traders a evitar condiciones de ejecución desfavorables.
Características clave:
• Visualización en vivo del spread (pips)
• Costo estimado de la operación para el tamaño de lote seleccionado
• Advertencia visual cuando el spread supera un umbral definido
• Superposición limpia en el gráfico
Este indicador no realiza operaciones ni genera señales de trading.
Está destinado como una herramienta de ejecución y concienciación de riesgos para traders manuales.
Adecuado para scalpers, traders intradía y cuentas de firmas propietarias.
*Precio de acceso anticipado. Las futuras actualizaciones pueden lanzarse a un precio regular más alto.
Resumen
Valoraciones de clientes
5 | 0 % | |
4 | 100 % | |
3 | 0 % | |
2 | 0 % | |
1 | 0 % |