Opis
Opis produktu: BullMoon Performance Panel
The BullMoon Performance Panel to potężne narzędzie analityczne dla cTrader, zaprojektowane, aby pomóc traderom monitorować ich wyniki w czasie rzeczywistym i wizualnie odtwarzać przeszłe transakcje bezpośrednio na wykresie.
1. Dane rynkowe i warunki
Panel analizuje Twoje dane handlowe związane z kontem oraz historyczne dane cenowe wybranego symbolu.
- Ocena obejmuje zarówno zamknięte, jak i otwarte transakcje, aby obliczyć kluczowe wskaźniki, takie jak zysk netto, obsunięcie kapitału oraz wskaźnik wygranych.
- Wskaźnik przeszukuje Twoją historię, aby precyzyjnie zlokalizować punkty wejścia i wyjścia.
2. Interpretacja sygnałów i elementów wizualnych
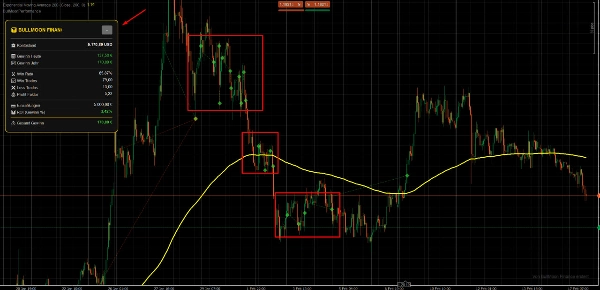
Aby analiza była jak najbardziej intuicyjna, narzędzie wykorzystuje czytelne oznaczenia wizualne bezpośrednio na wykresie:
- Symbole: Wejścia i wyjścia oznaczone są specyficznymi symbolami (np. strzałkami lub kropkami), co pozwala natychmiast zobaczyć, gdzie pozycja została otwarta i zamknięta.
- Linie wizualne: Linie łączące te symbole ilustrują czas trwania transakcji, czyniąc fazy zysku lub straty wizualnie namacalnymi.
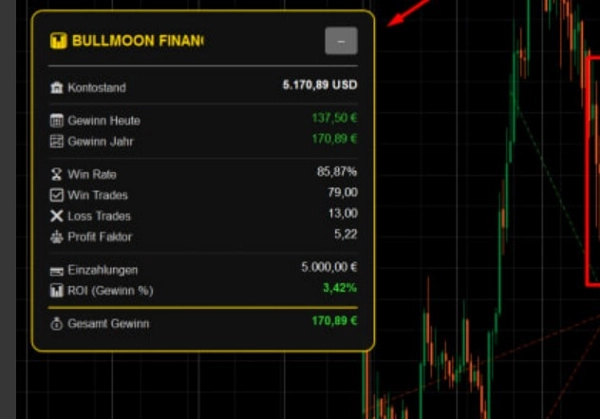
- Panel kontrolny: Kompaktowy panel na ekranie dostarcza twardych danych, w tym zysk w USD, łączną liczbę lotów oraz współczynnik R.
3. Kluczowe ustawienia i parametry
Możesz dostosować panel do swojego specyficznego stylu handlu:
- Okres historii: Określ, ile dni przeszłych transakcji ma być wyświetlanych na wykresie.
- Elementy wizualne: Kolory dla transakcji zyskownych i stratnych oraz przezroczystość linii i symboli są w pełni regulowane.
- Podstawa obliczeń: Ustaw stałe rozmiary lotów lub procentowe ryzyko dla wyników statystycznych.
4. Typowe zastosowania i scenariusze handlowe
- Analiza po transakcji: Przejrzyj swój dzień handlowy, aby upewnić się, że prawidłowo stosowałeś swoją strategię.
- Optymalizacja strategii: Wizualnie zidentyfikuj, czy poziomy Take Profit lub Stop Loss są konsekwentnie ustawione zbyt ciasno lub zbyt szeroko.
- Monitorowanie na żywo: Śledź swoje bieżące dzienne wyniki bez konieczności przełączania się między zakładką historii konta.
5. Docelowa grupa odbiorców (wielkość konta i doświadczenie)
- Poziom doświadczenia: Odpowiedni dla początkujących, którzy chcą lepiej wyczuć swoje transakcje, jak również profesjonalistów, którzy potrzebują szybkiego wizualnego sprawdzenia wyników.
- Wielkość konta: Odpowiedni dla każdego rozmiaru konta. Szczególnie cenny dla traderów prowadzących jednocześnie wiele strategii, którzy muszą utrzymać przejrzysty przegląd.
6. Ważne ograniczenia i uwagi dotyczące użytkowania
- Platforma: Opracowany wyłącznie dla cTrader.
- Dostępność danych: Wyświetlanie historycznych transakcji zależy od dostępności danych w historii konta cTrader.
- Nie jest generatorem sygnałów: Proszę zauważyć, że ten panel jest narzędziem analitycznym i nie generuje niezależnych sygnałów kupna ani sprzedaży.
Podsumowanie
The panel features a compact dashboard displaying key statistics including profit in USD, total lots traded, and the R-factor. Users can customize the display period for historical trades, adjust colors and transparency of visual elements, and set calculation parameters based on fixed lot sizes or percentage risk.
Typical use cases include post-trade analysis, strategy optimization by evaluating take profit and stop loss settings, and live monitoring of daily performance without switching views. The tool supports various markets and symbols such as Forex (EURUSD, GBPUSD, USDJPY), Indices (NAS100), Commodities (XAUUSD), Crypto (BTCUSD), and Stocks. It is suitable for traders of all experience levels and account sizes, especially those managing multiple strategies simultaneously. The panel is strictly an analytical tool and does not generate trade signals.
Opinie klientów
5 | 100 % | |
4 | 0 % | |
3 | 0 % | |
2 | 0 % | |
1 | 0 % |