Açıklama
SALINIM DEDEKTÖRÜ
Yapısal Salınım Noktaları + Fibonacci Düzeltmesi + RSI
--------------------------------------------------
ÜCRETSİZ GÖSTERGE
Yapısal salınımları tanımlayın. Trend'i görün. Uyumlulukla işlem yapın.
--------------------------------------------------
BU GÖSTERGE NE YAPAR
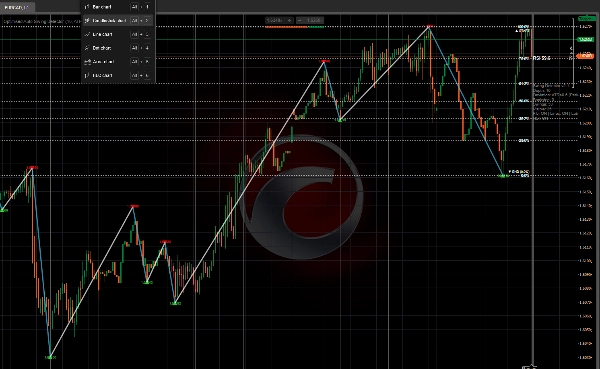
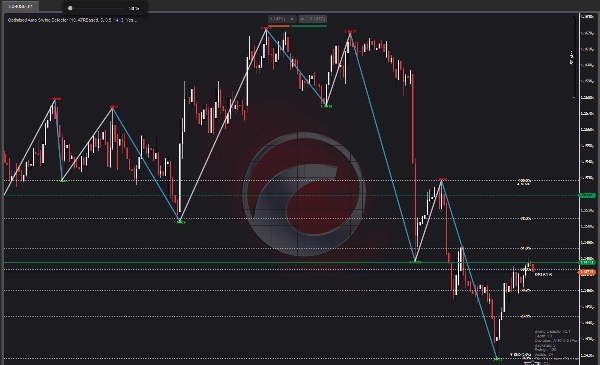
Salınım Dedektörü, yapılandırılabilir derinlik ve otomatik sapma filtresi ile yerel ekstremum tespiti kullanarak yapısal salınım yükseklerini ve düşüklerini tanımlar.
Daha sonra salınımları trend çizgileriyle bağlar, standart Fibonacci düzeltme seviyelerini üst üste koyar ve fiyatın yakınında mevcut RSI değerini gösterir.
--------------------------------------------------
ANA ÖZELLİKLER
- Salınım noktası tespiti (yapılandırılabilir derinlik)
- OTOMATİK SAPMA: ATR tabanlı filtreleme herhangi bir zaman dilimine uyum sağlar
- Sabit pip sapma modu (manuel kontrol için)
- Salınım trend çizgileri (yükseliş mavi, düşüş turuncu)
- FİBONACCİ DÜZELTMESİ (0, 23.6, 38.2, 50, 61.8, 78.6, %100)
- RSI DEĞER ÜSTÜ BİLGİSİ (fiyatın yakınında mevcut RSI)
- Özelleştirilebilir renkler
- Performans optimize edildi (çizilecek maksimum bar sayısı)
--------------------------------------------------
OTOMATİK SAPMA - ANA ÖZELLİK
İki sapma modu mevcuttur:
- SABİT PİPLER: Salınımlar arasında sabit minimum pip mesafesi ayarlayın
- ATR TABANLI (OTOMATİK): Mevcut volatiliteye dayalı dinamik sapma
OTOMATİK SAPMANIN ÖNEMİ:
- M1 ila M5: Dar sapma (küçük salınımları yakalar)
- H1 ila H4: Orta sapma (yapıyı yakalar)
- D1 ila MN1: Geniş sapma (büyük salınımları yakalar)
Gösterge kullandığınız zaman dilimine otomatik olarak uyum sağlar. Grafik değiştirirken manuel ayar yapmaya gerek yoktur.
Bu, Salınım Dedektörünü 1 dakikalık grafiklerden aylık grafiklere kadar TÜM zaman dilimlerinde kullanılabilir kılar.
--------------------------------------------------
FİBONACCİ DÜZELTMESİ - ANA ÖZELLİK
Son tamamlanan salınım için gösterge şunları çizer:
- %0.0 (salınım başlangıcı)
- %23.6
- %38.2
- %50.0
- %61.8
- %78.6
- %100.0 (salınım sonu)
Çizgileri ve etiketleri açıp kapatın. Tüm seviyeler hızlı görsel referans için renklendirilmiştir.
--------------------------------------------------
RSI ÜSTÜ BİLGİ - ANA ÖZELLİK
Mevcut RSI değeri fiyatın yakınında renk kodlaması ile gösterilir:
- KIRMIZI: RSI 70'in üzerinde (aşırı alım)
- YEŞİL: RSI 30'un altında (aşırı satım)
- BEYAZ: RSI 30 ile 70 arasında (nötr)
Bu, ayrı bir RSI penceresi açmadan anlık momentum bağlamı sağlar.
--------------------------------------------------
GÖRSEL ÖĞELER
- Kırmızı aşağı oklar = Salınım yüksekleri
- Yeşil yukarı oklar = Salınım düşükleri
- Mavi çizgiler = Yükseliş (düşükten yükseğe)
- Turuncu çizgiler = Düşüş (yüksekten düşüğe)
- Altın yatay çizgiler = Fibonacci seviyeleri
- Beyaz etiketler = Fibonacci yüzdeleri
- RSI değeri = Fiyatın yakınındaki mevcut RSI
- Bilgi paneli = Derinlik, sapma, geri adım, salınım sayısı
--------------------------------------------------
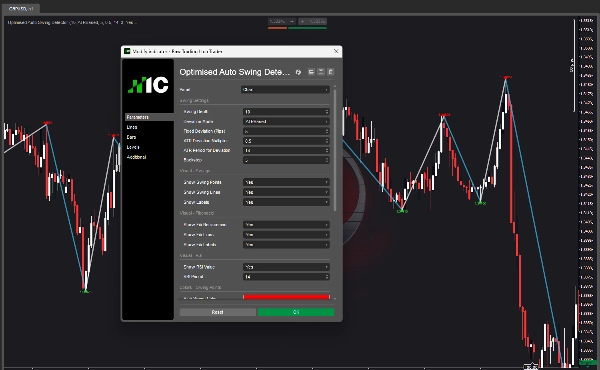
PARAMETRE GENEL BAKIŞ
SALINIM AYARLARI:
- Salınım Derinliği: Yerel ekstremumları kontrol etmek için kaç bar
- Sapma Modu: Sabit Pips veya ATR Tabanlı (Otomatik)
- Sabit Sapma: Salınımlar arasında minimum pip mesafesi
- ATR Sapma Çarpanı: ATR tabanlı sapma için çarpan
- ATR Periyodu: ATR hesaplama periyodu
- Geri Adım: Salınımlar arasındaki minimum bar sayısı
GÖRSEL - SALINIMLAR:
- Salınım Noktalarını Göster: Okları aç/kapat
- Salınım Çizgilerini Göster: Trend çizgilerini aç/kapat
- Etiketleri Göster: Fiyat etiketlerini aç/kapat
GÖRSEL - FİBONACCİ:
- Fib Düzeltmesini Göster: Fibonacci üst bilgisi aç/kapat
- Fib Çizgilerini Göster: Yatay çizgileri aç/kapat
- Fib Etiketlerini Göster: Yüzde etiketlerini aç/kapat
GÖRSEL - RSI:
- RSI Değerini Göster: RSI üst bilgisini aç/kapat
- RSI Periyodu: RSI hesaplama periyodu
RENKLER:
- Yüksek Salınım Rengi
- Düşük Salınım Rengi
- Yükseliş Çizgi Rengi
- Düşüş Çizgi Rengi
- Fib Çizgi Rengi
- Fib Metin Rengi
- RSI Etiket Rengi
PERFORMANS:
- Çizilecek Maksimum Bar: Daha hızlı performans için çizimi sınırlar
--------------------------------------------------
KULLANIM ALANLARI
- HERHANGİ bir zaman diliminde yapısal salınım noktalarını tanımlayın
- Salınımlar arasında trend çizgileri çizin
- Girişler, çıkışlar ve kar hedefleri için Fibonacci seviyelerini kullanın
- İşlemleri RSI uyumluluğu ile onaylayın
- Piyasayı bir bakışta anlayın
- Parametreleri ayarlamadan zaman dilimleri arasında geçiş yapın (Otomatik Sapma)
--------------------------------------------------
ZAMAN DİLİMİ KULLANILABİLİRLİĞİ
OTOMATİK SAPMA etkinleştirildiğinde, gösterge şunlarda çalışır:
- M1, M5, M15 (skalp işlemleri)
- M30, H1, H4 (gün içi işlemler)
- D1 (salınım işlemleri)
- W1, MN1 (pozisyon işlemleri)
Tek gösterge. Tüm zaman dilimleri.
--------------------------------------------------
YAPISAL ISI BÖLGELERİNE YÜKSELTME
Bu ücretsiz gösterge size salınımları ve yapıyı gösterir.
Yapısal Isı Bölgeleri daha ileri gider — katılım yoğunluğunu, kabul ve reddi ve piyasa etkileşimini birden çok bölgede haritalar.
Yapısal Isı Bölgelerini cTrader Mağazasında arayın.
--------------------------------------------------
INVICTUS EA'YA YÜKSELTME
Invictus EA, otomatik işlemleri yürütmek için aynı yapısal teknolojiyi kullanır.
Invictus'u cTrader Mağazasında arayın.
--------------------------------------------------
TEKNİK NOTLAR
- Üst bilgi göstergesi
- Herhangi bir zaman diliminde ve sembolde çalışır
- Yeniden boyama yok (salınımlar tarihsel)
- Performans için optimize edildi
--------------------------------------------------
DESTEK
Ömür boyu güncellemeler dahildir.
DAHA FAZLA BİLGİ İÇİN - Aşağıdaki Geliştirici Profiline tıklayın.
Özet
Müşteri değerlendirmeleri
5 | 100 % | |
4 | 0 % | |
3 | 0 % | |
2 | 0 % | |
1 | 0 % |