
Açıklama
YAPISAL ISI BÖLGELERİ
Katılım Yoğunluğu Haritası
--------------------------------------------------
Fiyatın mücadele ettiği yerleri görün. İhmal ettiği yerleri görün.
Çoğu destek/direnç aracı, fiyatın OLDUĞU yerlerde çizgiler çizer.
Yapısal Isı Bölgeleri şunu yanıtlar: Piyasa gerçekten bu seviyeyle İLGİLENİYOR MU?
--------------------------------------------------
ISI YOĞUNLUĞU PUANLAMASI (0'dan 100'e)
Gösterge, salınım kümelenmesini analiz eder ve bir ısı puanı atar:
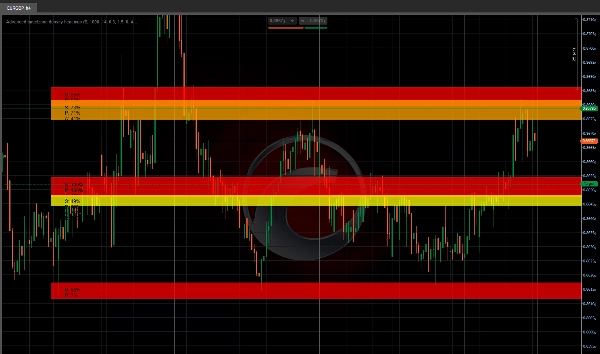
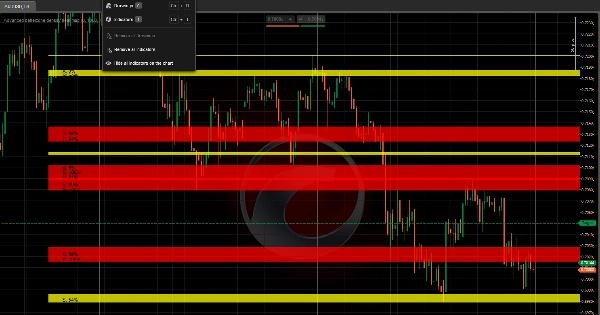
- Kırmızı bölgeler (80 ila 100 ısı) = En güçlü yapısal katılım
- Turuncu bölgeler (60 ila 80 ısı) = Aktif yapısal bölge
- Sarı bölgeler (40 ila 60 ısı) = Orta düzey ilgi
- Mavi bölgeler (40 ısının altında) = Zayıf yapı
Daha yüksek ısı = daha fazla kümelenmiş salınım = daha fazla piyasa dikkati.
--------------------------------------------------
KABUL VE RED TAKİBİ
Her yapısal ısı bölgesi için gösterge fiyat davranışını takip eder:
- KABUL = Fiyat bölge içinde kapanır (destek davranışı)
- RED = Fiyat bölgede uzun fitiller bırakır (direnç davranışı)
Bu, bir bölgenin TUTMA veya GERİ ÇEVİRME olasılığını size söyler.
--------------------------------------------------
PİYASA KATILIM ANALİZİ
Sistem şunları ölçer:
- Mum dokunuşları (fiyatın her bölgeyi ne sıklıkla ziyaret ettiği)
- Bölge içinde kapanışlar (kabul oranı)
- Fitil reddi (red oranı)
- Yapılandırılabilir geriye dönük dönem
Düşük katılım = zayıf bölge. Yüksek katılım = yapısal ısı bölgesi.
--------------------------------------------------
GÖRSEL YOĞUNLUK HARİTASI
- Isı puanına göre renk kodlu bölgeler (kırmızı = en sıcak)
- Red görselleştirmesi için halo uzantıları
- Veri etiketleri gösterir: Isı / Katılım / Kabul / Red puanları
- Otomatik temizleme (bölgeler otomatik olarak yeniden çizilir)
- İsteğe bağlı salınım yüksek/düşük okları
--------------------------------------------------
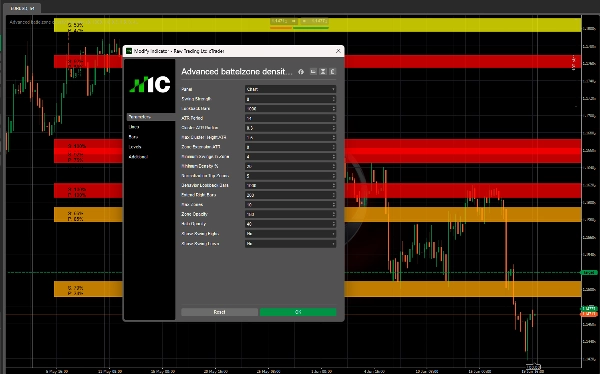
ANA PARAMETRELER
- Salınım Gücü: Pivot hassasiyeti (yüksek = daha az salınım)
- Geriye Dönük Çubuklar: Salınımları tespit etmek için ne kadar geriye bakılacağı
- ATR Dönemi: Uyarlanabilir yarıçap hesaplaması için
- Küme ATR Yarıçapı: Salınımların kümelenmesi için ne kadar yakın olması gerektiği
- Maksimum Küme Yüksekliği ATR: Bu genişlikten daha geniş bölgeleri reddeder
- Bölge Uzantısı ATR: Red tespiti için halo boyutu
- Bölgedeki Minimum Salınımlar: Minimum küme boyutu
- Minimum Isı Puanı: Sadece bunun üzerindeki bölgeleri göster
- Davranış Geriye Dönük Çubuklar: Katılım takibi için dönem
- Maksimum Bölgeler: Gösterilen maksimum bölge sayısı
- Bölge / Halo Opaklığı: Görsel şeffaflık
--------------------------------------------------
KULLANIM ALANLARI
- Gerçek yapısal ısı bölgelerini bulun (yüksek ısı + yüksek katılım)
- Kabul bölgelerini red bölgelerinden ayırt edin
- Düşük ısı, düşük katılım alanlarından kaçının
- Giriş ve çıkış yerleştirmeleri için yapısal kümeleri tanımlayın
- Trend göstergeleri veya emir akışı ile örtüşme
--------------------------------------------------
TEKNİK NOTLAR
- Üst üste binen gösterge (fiyat grafiği üzerinde çizer)
- Her zaman diliminde ve sembolde çalışır
- ATR aracılığıyla volatiliteye otomatik uyum sağlar
- Yeniden boyama yapmaz (salınımlar tarihsel)
--------------------------------------------------
INVICTUS EA YAPIMCILARINDAN
Yapısal Isı Bölgeleri, Invictus otomatik ticaret sisteminde bulunan aynı yapısal katılım teknolojisini paylaşır.
--------------------------------------------------
RİSK AÇIKLAMASI
Bu gösterge bir analiz aracıdır. Otomatik ticaret sinyalleri üretmez. Tüm ticaret kararları kullanıcının sorumluluğundadır.
--------------------------------------------------
DESTEK
Ömür boyu güncellemeler dahildir.
DAHA FAZLA BİLGİ İÇİN - Aşağıdaki Geliştirici Profiline tıklayın.
Özet
Key features include color-coded heat zones, halo extensions for rejection visualization, and data labels displaying heat, participation, acceptance, and rejection scores. The system measures candle touches, closes inside zones, and wick rejections over a configurable lookback period to quantify market engagement. Adjustable parameters allow customization of swing sensitivity, cluster radius, zone size, and visual opacity.
This tool supports any timeframe and symbol, adapts to volatility using ATR, and does not repaint historical swings. It is intended for identifying genuine structural heat zones, differentiating acceptance from rejection areas, and aiding entry and exit placement in conjunction with other trend or order flow indicators. The indicator is analytical and does not generate automated trading signals.
Müşteri değerlendirmeleri
5 | 100 % | |
4 | 0 % | |
3 | 0 % | |
2 | 0 % | |
1 | 0 % |


!["[CB] Pivot Points Pro" logosu](https://cdn.ctrader.com/image/webp/43463c82-67b0-4f10-a4ba-901bba091d81_32594)


