Description
▁▂▃▄▅▆▇ █ 10,000+ traders (institutional + retail) █ ▇▆▅▄▃▂▁
- Choose our TOP indicators in cTrader 🏆
- ✨ Exclusive precision for superior results ✨
- 📈 Our algorithms —with the highest-rated visuals 🎯—
- have been successfully implemented in 2 quant funds
▁▂▃▄▅▆▇ █████████████████████████████ ▇▆▅▄▃▂▁
_______________________________________________
_______________________________________________
📌 Market Structure Indicators
· ✅ AdvancedMarket Structure: Bos, Choch, SwinLevels, Order Blocks, Market Structure& Liquidity Finder
· 🔄 Dynamic Market StructureAnalysis of Turning Points
· 🧱 Order Block
· ⚖️ Market Imbalance
· ⛓️ BOS & CHOCH
· 🧠 ICT Power of 3
______________________________________________________________-
Store cBots : 🧠 Gold & BTC BreakoutSession Pivots 🧠
_______________________________________________
🔚 Smart Exit Systems
_______________________________________________
📐 ZigZag Indicators
· 🔍 ZigZag Price LiquidityProjection
· ➖ ZigZag
_______________________________________________
🧱 Support & Resistance Indicators
· 🟩 SmartTrend Support &Resistance Lines
· 🧱 All Support and ResistanceLevels
_______________________________________________
📊 Trend & Channel Indicators
· 📊 Supertrend
_______________________________________________
💧 Volume & Liquidity Tools
_______________________________________________
⚡ Momentum & RSI Indicators
· 🔎 Multi-Level Candle BiasTracker
_______________________________________________
🔮 Prediction & Projection Tools
· 📐 Prediction Based on Linreg& ATR
· 📏 Fibonacci Linear RegressionMulti-timeframe
· 📈 Volume-Powered Market Flow Projector
______________________________________________________________________________________________________
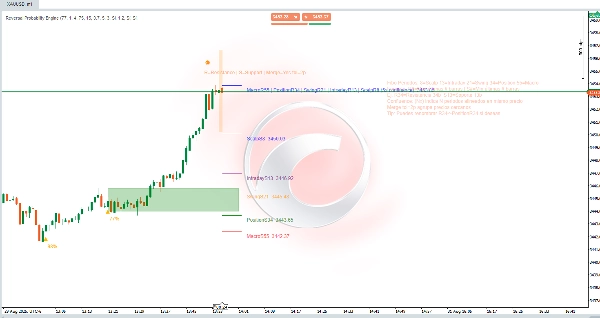
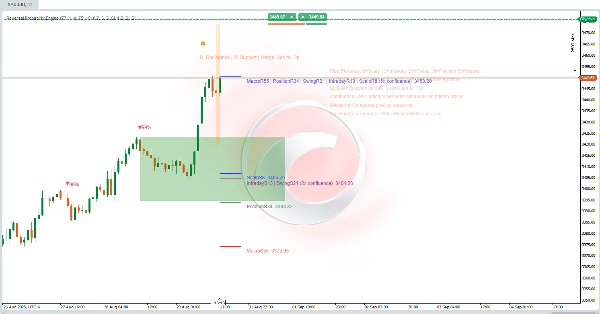
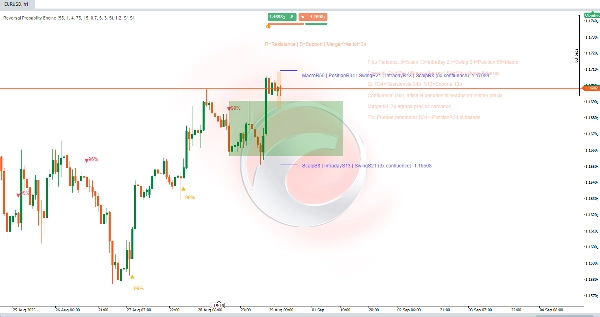
REVERSAL PROBABILITY ENGINE 🔄
A hybrid indicator for detecting reversal zones + multidimensional mapping of support and resistance "Golden Levels." It combines structure analysis (Fibonacci window highs/lows), dynamics (price velocity and acceleration), entropy/chaos (order vs. disorder), momentum, and volume to generate:
- Hierarchical support/resistance levels by time horizon.
- Probabilistic signals of potential reversal (peaks and valleys) with a % confidence. ⚠️
- Active zones (rectangle) to contextualize trades and stops.
- Confluence clusters (when multiple timeframes coincide at the same price). 🎯
2. Objective
Reduce visual noise and facilitate decision-making by identifying:
- Where price has been compressed or anchored across various horizons.
- Where the statistical probability of a reversal increases (confirmed or anticipated). 📊
- Which levels have the greatest "weight" (confluence).
3. Conceptual Logic
a) Levels: For each Fibonacci window, the recent high (R) and low (S) are taken; this provides a fractal scale of contexts (ultra-short to macro).
b) Fusion: If several distinct levels fall within X pips, they are grouped → a cluster with a combined label and confluence count.
c) Reversal Signals: Local exhaustion patterns (wave form), deceleration (slope change), low entropy drop (low entropy = more directional movement predisposed to reverse), possible internal divergences, and momentum/volume validations are sought.
d) Predictive Mode: Allows anticipating reversals (diamond) before full confirmation if contrary acceleration + low entropy + extreme state align. 💎
e) Probability: Normalized weighting of various factors (trend, chaos, momentum, volume, divergence, adaptation). Truncated result 40–99%.
f) Active Zone: After a signal, the most logical range (between relevant levels) is sought to manage the trade and contextualize stops.
4. Visual Components
- Horizontal lines: Levels by period (Scalp 8, Intraday 13, Swing 21, Position 34, Macro 55). Consistent color per horizon.
- R#/S# Labels: R = Resistance (recent high of that window), S = Support (recent low). E.g.: R34 = resistance derived from the last 34 candles.
- Merged Labels:
ScalpS8 | IntradayS13 | … (5x confluence) Price. Indicates that N distinct periods yield the same level (or within tolerance). The more, the greater the relevance. ✅ - (Nx confluence): Number of coinciding periods.
- Merge tol=Xp: Tolerance in pips that groups nearby levels (avoids saturation).
- Probabilities (%): Text above/below triangles (Down / Up) or diamond (early detection).
- Green rectangle (active zone): Dynamic operational channel where post-signal evolution is evaluated.
- Additional subtle blocks/colors: Support elements (waves/particles) if activated.
5. Practical Interpretation
- High confluence (≥3x) = strong "magnet" or pivot level; watch for price reaction. 🧲
- Signal + nearby confluence reinforces validity (but does not guarantee).
- Probability ≥ Min Confidence %: Minimum filter to consider action.
- Differentiate Anticipated (diamond) vs. Confirmed (triangle): The anticipated offers better risk/reward, higher false rate; the confirmed arrives with less asymmetry but more validation.
- Rectangle: If price remains inside and does not invalidate the opposite edge, the thesis remains alive; a clean break reduces expectation.
- Expand or decrease MergeTolerance: Smaller = greater granularity, Larger = more synthesized clusters.
6. Usage Flow
- Load the indicator on the desired instrument and timeframe.
- Adjust the Min Confidence % according to tolerance (e.g., lower for scalping, higher for swing).
- Check if a multiple support/resistance cluster appears (5x, 4x, etc.).
- Wait for a signal (ideal if it arises on the periphery of the cluster and with high probability). 🔔
- Delimit management within the active zone: staggered entry or confirmation of failed breakout.
- Define a logical stop: beyond the first lower (in long) or upper (in short) level not present in the confluence.
- Deactivate periods you don't use (e.g., only Swing/Macro for long positions).
- Adjust tolerance and, optionally, hide the explanatory panel once learned.
7. Quick Label Reading ExampleScalpS8 | IntradayS13 | SwingS21 | PositionS34 | MacroS55 (5x confluence)
Meaning: All timeframes (8–55) share the same floor → multi-scale structural support. Higher probability of reaction; if lost with volume, it implies a more serious regime change. 🚨
Summary
Key features include:
- Hierarchical support and resistance levels categorized by time horizons (from ultra-short scalp to macro scales).
- Probabilistic reversal signals indicating potential peaks and valleys with confidence percentages.
- Active zones displayed as rectangles to help contextualize trade entries and stop placements.
- Confluence clusters that highlight price levels confirmed across multiple timeframes, enhancing level significance.
The indicator reduces visual noise by grouping nearby levels within a tolerance range and provides clear visual components such as horizontal lines, labeled resistance/support points, merged confluence labels, probability percentages, and active zones. It distinguishes between anticipated and confirmed reversal signals, offering traders options for risk management and trade timing.
Users can adjust confidence thresholds and merge tolerances to tailor granularity and filtering according to their trading style and timeframe. The tool supports structured decision-making by identifying statistically significant reversal areas and multi-scale support/resistance clusters on any instrument and timeframe.
Customer reviews
5 | 0 % | |
4 | 0 % | |
3 | 0 % | |
2 | 0 % | |
1 | 100 % |