Ichimoku Kinko Hyo
"Ichimoku Kinko Hyo" logo
20/07/2025
55
Desktop
Since 20/03/2025
Free installs
55
"Ichimoku Kinko Hyo" uploaded image

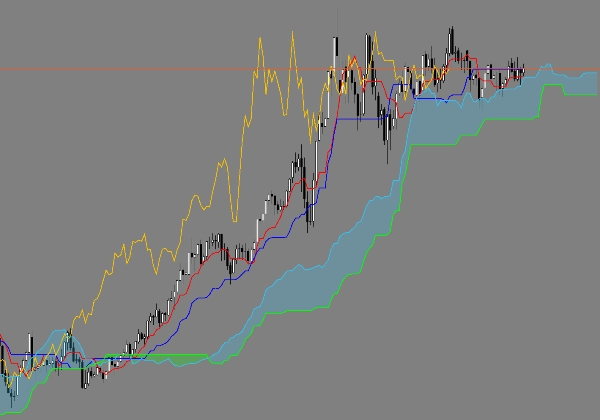
This is a corrected Ichimoku Kinkō Hyō indicator for cTrader. By default, cTrader’s displacement is 26 and starts counting from zero, which causes the Chikou Span and the Kumo (cloud) to be shifted incorrectly. This version fixes that by using a fixed 25-period shift for both the Chikou Span (moved 25 periods back) and Kumo lines (moved 25 periods forward), matching the original Japanese specification and platforms like TradingView. This ensures all Ichimoku lines are calculated and plotted in the correct positions for accurate signals and analysis.

0.0
Reviews: 0
Customer reviews
No reviews for this product yet. Already tried it? Be the first to tell others!
You may also like
Bars color 1
This is the first version I offer you for free.
Indicator
NAS100
Indices
XAUUSD
+6
cAlgoBuddy - Boxify
The purpose of the algorithm of the Boxify indicator is to try to put price action into zones, or better, boxes.
LDE - Market Sessions
🇫🇷 Visualisez vos sessions de marché et OPR d'un coup d’œil 🇬🇧 Visualize your market sessions & OPR at a glance !
Indicator
Indices
Prop
Commodities
+3
PivotLevels
It draws Pivot Levels on the chart.
Indicator
Stocks
Forex
Crypto
+1
Market Structure SNR + Auto Bias
Market Structure Indicator – Your Trading Map in a Noisy Market. No more Panicking Which one, Where, Why and How.
Fibonacci Prediction Channel
Designed to plot a future prediction channel based on Fibonacci retracement levels 📊
Indicator
NAS100
Indices
XAUUSD
+2
AlgoCorner DonchianPSAR
Visualize market asymmetry like never before — steady climbs meet sudden drops with the Donchian PSAR
Scalper Signal MTF
This code is a custom scalping indicator for the cTrader platform.
Indicator
Breakout
Stocks
Commodities
+1
Advanced Donchian Zones
MTF Donchian: Identify trend breakouts & key zones with precision. Perfect for swing & day traders seeking accuracy!
Indicator
NAS100
NZDUSD
Breakout
+12
Multi_TF Candlestick Chart Overlay
Perfect for traders who demand a clear overview of multiple timeframes at a glance.
Indicator
Indices
RSI
Stocks
+5
REDGREENZONEREVERSAL
The Red & Green Zone Reversal Indicator detects overbought and oversold market conditions using Bollinger Bands and RSI.
Indicator
Grid
NAS100
RSI
+19
Smart Volume Delta
Detects smart money activity using advanced tick volume and price divergence analysis.
Indicator
XAUUSD
Breakout
Stocks
+6
Signal Strike
Signal Strike is a professional trading indicator delivers clear, high‑confidence entry signals directly on your chart
Indicator
Grid
NAS100
NZDUSD
+17
Institutional Volume Supply Demand
Volume Profile Supply Demand
HeatMap Candle
HeatMap Candle
Candle Timer & Strength Panel Demo -
Candle Timer & Strength Panel DEMO for cTrader DEMO VERSION – 24 hours free trial! This is a DEMO version of the Candle
Indicator
Grid
Indices
Breakout
+8
TSPivotSMC
Pivot Point MultiTimeFrame with Order Block