
Description
📊 STVL Pro by Zofesu — SFP Trend & VWAP Liquidity Detection.
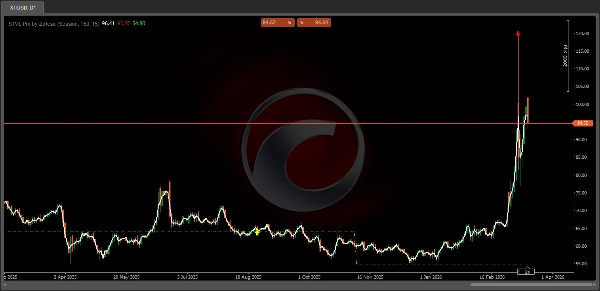
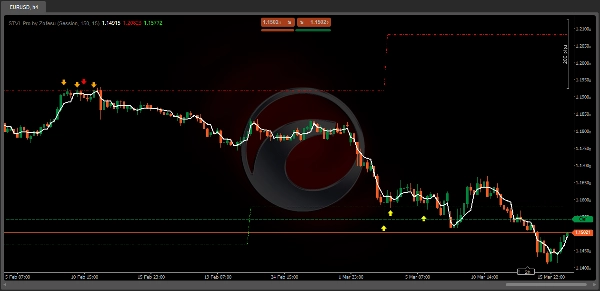
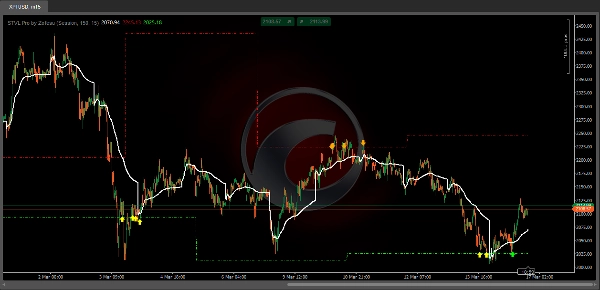
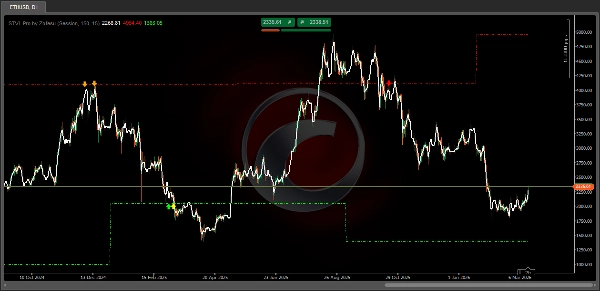
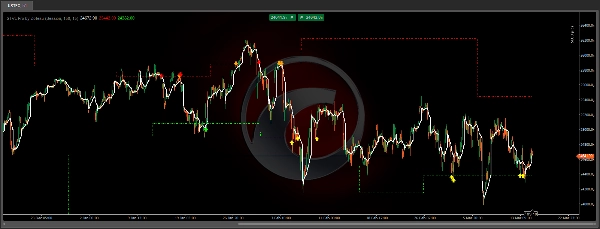
STVL Pro is a precision overlay indicator combining three powerful concepts into one clean tool: Session VWAP, dynamic Swing Liquidity levels, and real-time SFP (Swing Failure Pattern) signal detection.
⚙ HOW IT WORKS
The indicator continuously tracks the highest and lowest confirmed swing pivot points within a configurable lookback window. These levels represent where stop losses and liquidity clusters are typically located. When price briefly breaks through one of these levels but closes back inside — a classic liquidity sweep — the SFP signal fires.
Signal color tells you the full story at a glance:
Green arrow (close > VWAP) — high-conviction bullish reversal
Yellow arrow (close < VWAP) — bullish sweep but below value area
Red arrow (close < VWAP) — high-conviction bearish reversal
Orange arrow (close > VWAP) — bearish sweep but above value area
Note: Signals on the current (unclosed) bar may update in real time as price develops — this is intentional. A forming signal indicates the market is still deciding. Final confirmation occurs on bar close.
🔑KEY FEATURES
✅ Anchored VWAP — resets by Session, Week, Month, or Year
✅ Dynamic Swing Liquidity Levels — auto-updating Upper and Lower bands
✅ SFP Detection — confirms sweep + close back inside the range
✅ VWAP-filtered signal coloring — instantly know if you are trading with or against value
✅ Configurable lookback (default 150 bars)
✅ Zero repaint on confirmed bars
✅ Lightweight C# — no performance impact
📚HOW TO USE
1. Add STVL Pro to any chart and timeframe
2. Watch for dashed green/red horizontal lines — these are your active liquidity levels
3. Wait for a candle to spike through the level and close back inside
4. An arrow appears — color tells you the conviction level vs VWAP
5. Use as a standalone signal or combine with your existing strategy
Best results on: M15, H1, H4, D1
Works on: Indices (NAS100, SPX500), Forex, Gold, Oil, Crypto
🔗PARAMETERS
- VWAP Anchor — Session / Week / Month / Year
- SFP Lookback — number of bars to define swing high/low (default 150)
- Label Offset (Pips) — vertical distance of arrow from price
⚠️ DISCLAIMER
Trading financial instruments involves substantial risk of loss. Past performance of any indicator or strategy does not guarantee future results. This tool is provided for informational and educational purposes only. Always use proper risk management and never risk more than you can afford to lose. The author is not responsible for any trading losses incurred through the use of this indicator.


!["[Hamster-Coder] Pivot Points MTF" logo](https://cdn.ctrader.com/image/webp/4c143e5a-309c-40e3-a578-f04d1e133ffa_31159)


