

Description
# 🚀 Kinetic Slippage Index (KSI) – Advanced Market Pressure & Liquidity Analysis Tool
Unlock deeper market insights with the **Kinetic Slippage Index (KSI)** — a powerful trading indicator designed to identify unusual price movement, volume imbalance, and potential liquidity events before they become obvious on the chart.
Built for traders who analyze **market structure, volume behavior, volatility, and institutional activity**, KSI combines range expansion and volume dynamics to measure abnormal market conditions.
## 🔥 Key Features
✅ **Kinetic Slippage Index Calculation**
* Measures the relationship between price movement and traded volume.
* Detects situations where price moves disproportionately compared to normal volume behavior.
* Helps identify potential liquidity stress, aggressive market activity, and unusual momentum.
✅ **Adaptive Spike Detection**
* Automatically calculates dynamic spike levels based on recent market behavior.
* Uses statistical deviation analysis to highlight extreme market events.
* Adapts to changing volatility conditions without requiring constant manual adjustments.
✅ **Real-Time Spike Alerts 🚨**
* Receive notifications when abnormal volume/range divergence occurs.
* Helps traders quickly identify potential breakout conditions, liquidity grabs, or sudden market pressure.
✅ **Volume & Flow Analysis 📊**
* Tracks current volume compared to its EMA average.
* Highlights when trading activity is unusually high.
* Includes cumulative delta analysis to visualize buying and selling pressure.
✅ **Signal Line Confirmation 📈**
* Smooth signal calculation helps identify changes in KSI momentum.
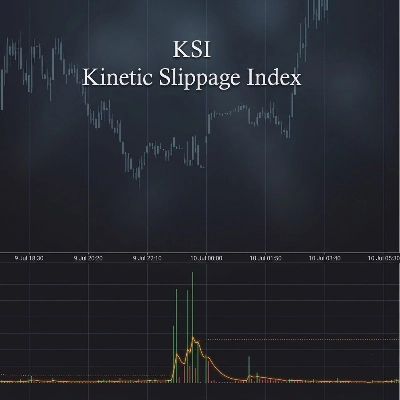
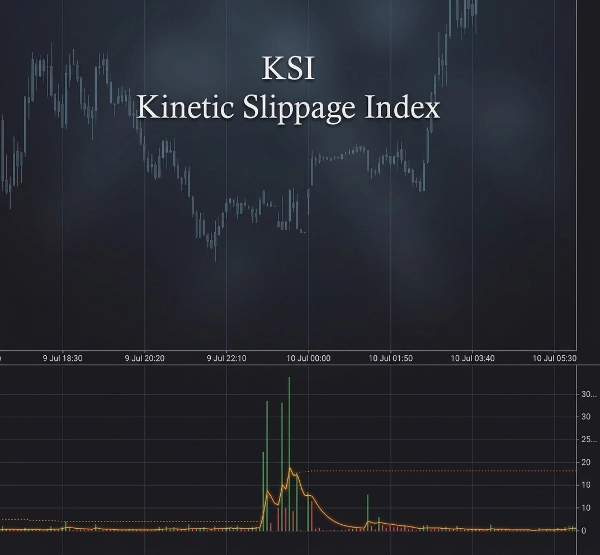
* Green/red histogram visualization makes market pressure shifts easy to read.
## 🕒 Trading Session Intelligence
KSI includes automatic market session tracking:
🌏 Asia Session
🇬🇧 London Session
🇺🇸 New York AM
☕ New York Lunch
🌆 New York PM
The built-in killzone display helps traders understand when liquidity and volatility are typically higher.
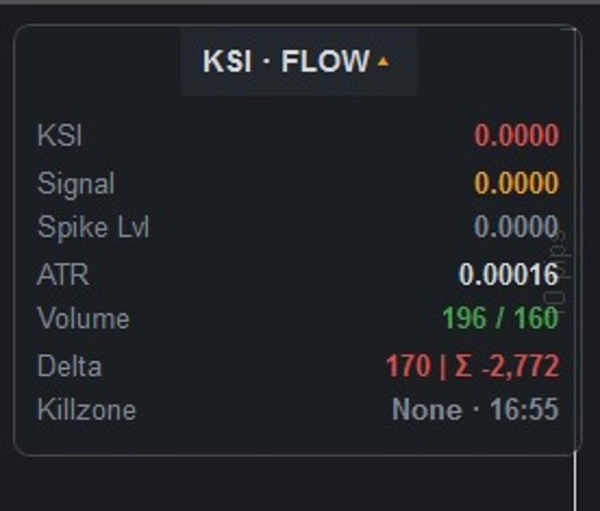
## 📌 Professional Information Panel
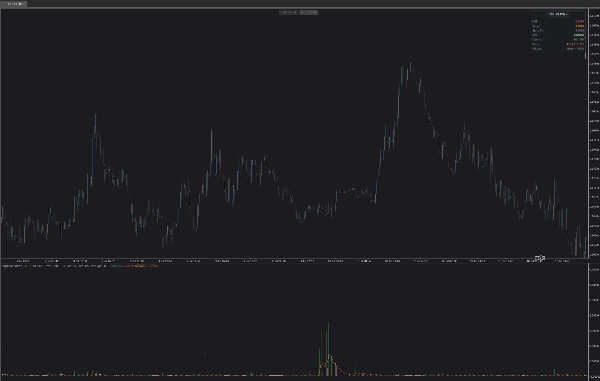
The integrated dashboard provides a clean overview directly on your chart:
📍 Current KSI value
📍 Signal level
📍 Adaptive spike threshold
📍 ATR volatility reading
📍 Current volume vs average volume
📍 Delta & cumulative delta
📍 Active trading session / killzone
The panel can be:
* ✅ Positioned in any chart corner
* ✅ Collapsed or expanded
* ✅ Adjusted with custom opacity
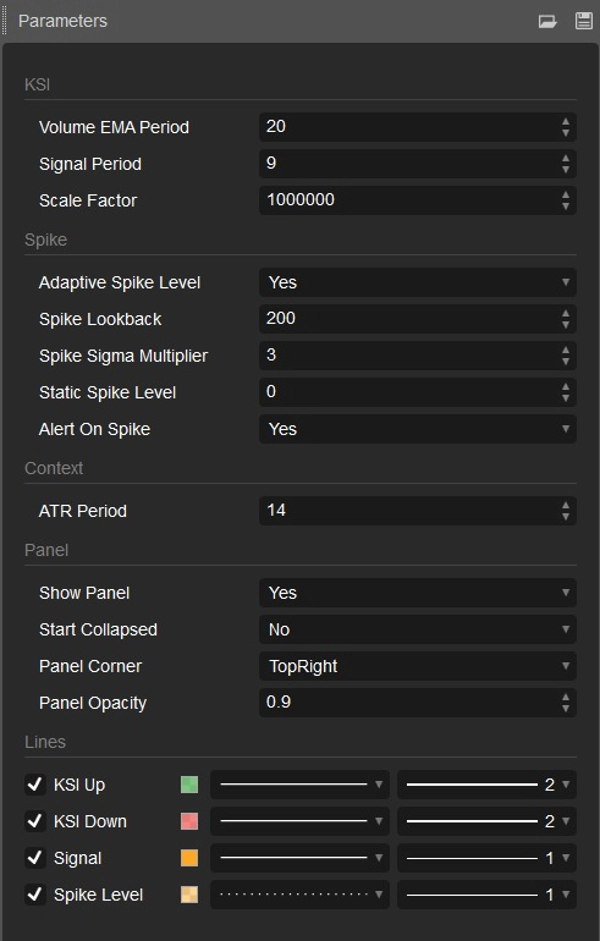
## ⚙️ Customizable Settings
Fine-tune KSI for any trading style:
🔧 Volume EMA Period
🔧 Signal Period
🔧 Scale Factor
🔧 Adaptive or fixed spike detection
🔧 Spike lookback period
🔧 Spike sensitivity multiplier
🔧 ATR period
🔧 Panel appearance settings
## 🎯 Designed For
✔ Forex traders
✔ Futures traders
✔ Crypto traders
✔ Scalpers
✔ Day traders
✔ Market structure analysts
✔ Traders looking for volume-based confirmation
## 💡 How Traders Use KSI
KSI can help identify:
⚡ Unusual market activity
⚡ Potential breakout pressure
⚡ Volume-price divergence
⚡ Liquidity events
⚡ Momentum changes
⚡ High-volatility trading opportunities
Combine KSI with your existing strategy to gain a clearer view of **when the market is moving normally — and when something unusual is happening.**
📈 Trade smarter. Understand market pressure. Detect hidden activity with the Kinetic Slippage Index.
Summary
The indicator includes volume and flow analysis by comparing current volume to its exponential moving average (EMA) and incorporates cumulative delta analysis to visualize buying and selling pressure. A smooth signal line and histogram help confirm changes in KSI momentum, making shifts in market pressure easier to interpret.
KSI tracks major trading sessions—Asia, London, and New York (AM, Lunch, PM)—highlighting periods of higher liquidity and volatility. A professional information panel displays key metrics such as current KSI value, signal level, adaptive spike threshold, ATR volatility, volume comparisons, delta values, and active trading sessions. This panel is customizable in position, size, and opacity.
Settings allow fine-tuning of volume EMA period, signal period, scale factor, spike detection parameters, ATR period, and panel appearance. KSI is suitable for forex, futures, and crypto traders, including scalpers, day traders, and market structure analysts seeking volume-based confirmation and insights into unusual market activity, breakout pressure, liquidity events, and momentum changes.
Discussion
Customer reviews
5 | 0 % | |
4 | 100 % | |
3 | 0 % | |
2 | 0 % | |
1 | 0 % |
FAQ
More from this author
















Price