


Opis
Hyper Trend PRO nie tylko informuje, że trend się odwrócił. Mówi również, na ile reszta wykresu się z tym zgadza.
Jak powstaje sygnał
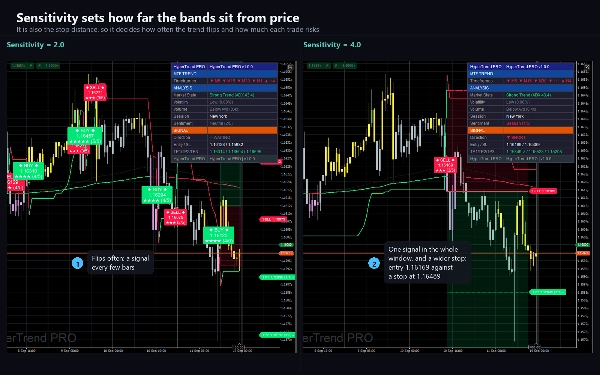
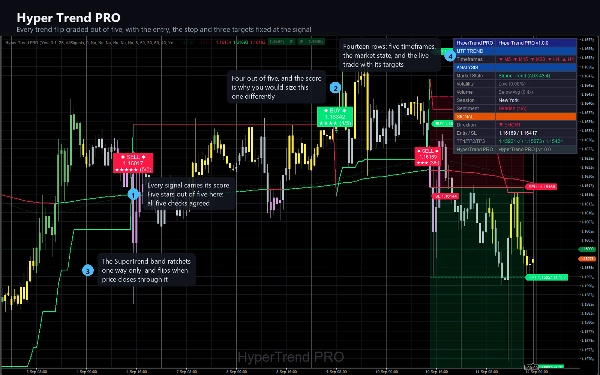
SuperTrend oparty na średnim zakresie prawdziwym (ATR) wyznacza trend. Pasy są umieszczone powyżej i poniżej ceny na wielokrotności 25-okresowego ATR, każdy pas przesuwa się tylko w jednym kierunku, a trend zmienia się, gdy cena zamyka się po drugiej stronie pasa. Każdy sygnał zaczyna się od takiego odwrócenia i nic innego go nie tworzy.
Następnie odwrócenie jest oceniane w skali od jednego do pięciu. Pięć niezależnych czynników głosuje:
- histogram MACD, rosnący lub malejący względem poprzedniego słupka
- EMA z 150 okresów względem EMA z 250 okresów
- ADX powyżej 20, więc odwrócenie w martwym zakresie jest oznaczane jako jedno
- wolumen względem jego własnej 20-okresowej średniej
- nachylenie 55-okresowej średniej ruchomej Hull
Wynik jest rysowany na sygnale jako gwiazdki i jako liczba od jednego do pięciu, a na alertach nazywany jest Słaby, Umiarkowany lub Silny. To różnica między odwróceniem, z którym zgadzają się cztery inne miary, a takim, które stoi samo.
Wybór selektywności
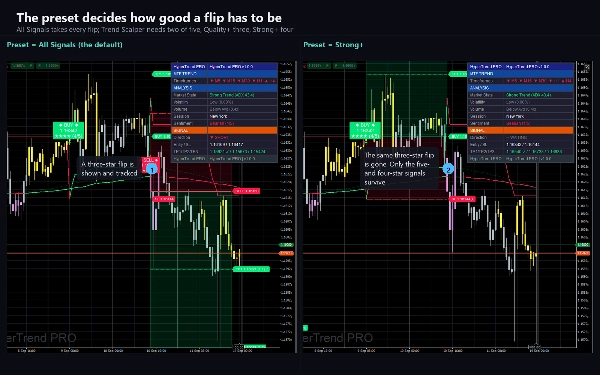
Preset ustawia minimalny wynik, jaki musi zdobyć odwrócenie: All Signals bierze wszystko, Trend Scalper potrzebuje dwóch, Quality+ trzech, a Strong+ czterech. Sześć dodatkowych filtrów może każdy samodzielnie zablokować sygnał: tylko rynki trendujące, tylko silne wyniki, tylko wolumen powyżej średniej, tylko zgodne z chmurą oraz tryb kontrariański, który bierze odwrócenie tylko wtedy, gdy wygładzony RSI jest już rozciągnięty w przeciwną stronę. Każdy z nich jest wyłączony, dopóki go nie włączysz.
Transakcja, którą rysuje
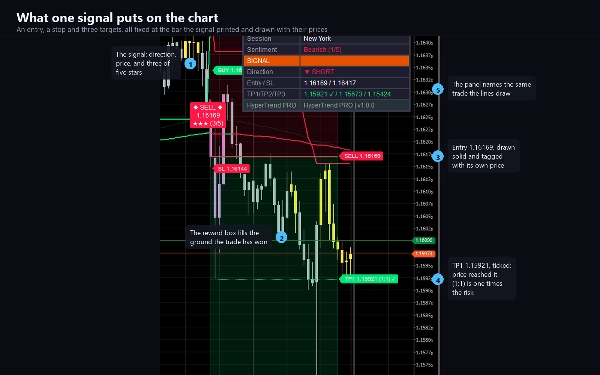
W momencie pojawienia się sygnału, wskaźnik ustala wejście, stop loss i trzy cele oraz rysuje każdy z nich jako oznaczoną linię z ceną.
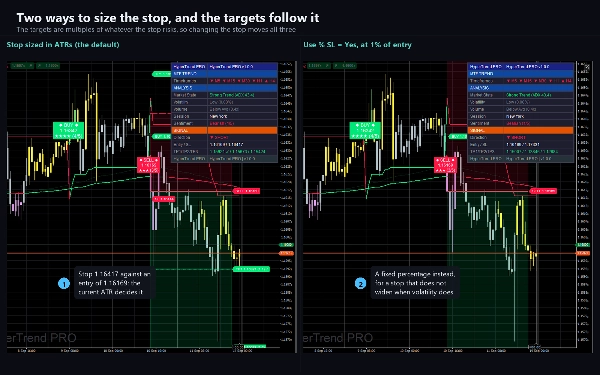
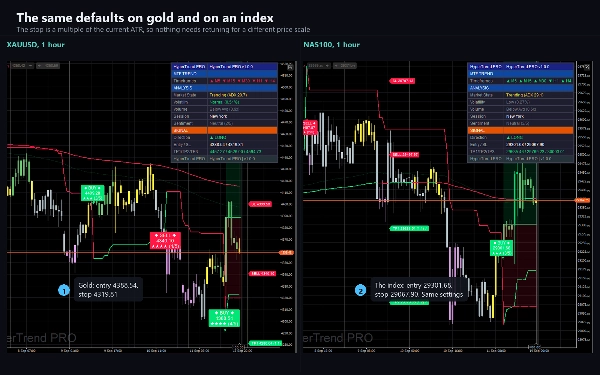
- Stop loss to wielokrotność aktualnego ATR, więc te same ustawienia działają sensownie na wykresie pięciominutowym i dziennym, na parach walutowych i na złocie. Dostępny jest też stały procentowy stop loss.
- Trzy cele to wielokrotności tego samego ryzyka, więc domyślne wartości 1.0, 2.0 i 3.0 to dosłownie jeden, dwa i trzy razy to, co ryzykujesz.
- Każdy cel jest odhaczany, gdy cena go osiąga. Osiągnięcie trzeciego celu lub stop loss zamyka śledzoną transakcję.
- Opcjonalny trailing stop ATR jest rysowany za otwartą transakcją.
Co jeszcze jest na wykresie
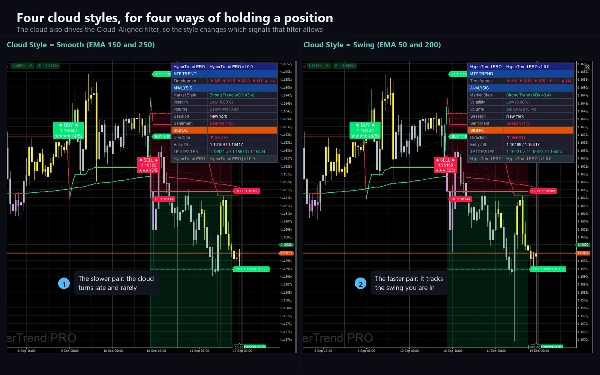
- Chmura między dwoma średnimi ruchomymi, w czterech stylach: para wygładzonych EMA, dwie warianty skalpingowe i para swingowa.
- Linia Trend Tracer z 250 okresów, która zmienia kolor wraz z ceną.
- Świece zabarwione na sześć stopni w zależności od siły histogramu MACD względem zmienności, więc osłabienie ruchu jest widoczne zanim nastąpi odwrócenie. Ustawienie Kolorowanie świec przełącza je na kolory trendu, cieniując według wyniku konfluencji lub pozostawia bez zmian, gdy inny wskaźnik koloruje świece na tym samym wykresie.
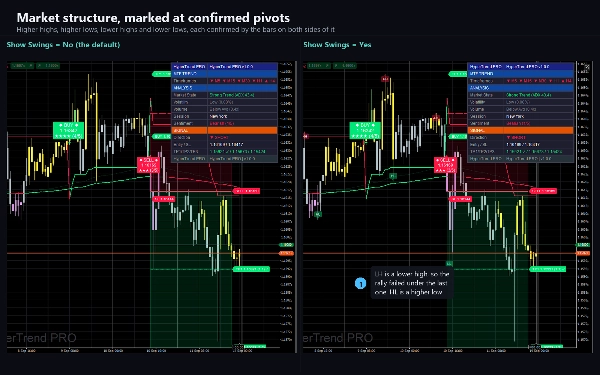
- Opcjonalne etykiety struktury rynku oznaczające wyższe szczyty, niższe szczyty, wyższe dołki i niższe dołki.
- Opcjonalne markery cofnięć z oscylatora WaveTrend, do ponownego wejścia w trend, a nie na jego początku.
Panel kontrolny
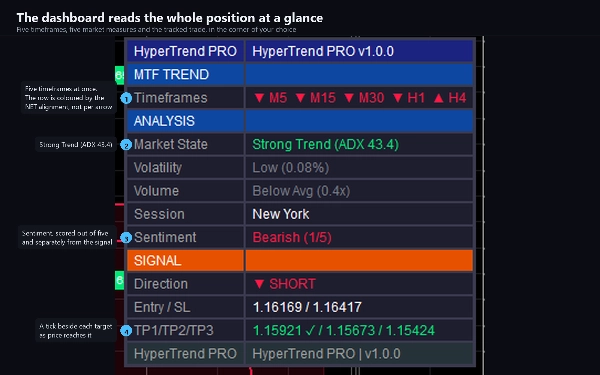
Czternaście wierszy w wybranym przez Ciebie rogu. Górny blok odczytuje pięć ram czasowych naraz, od M5 do H4, i pokazuje, w którą stronę każda z nich się skłania. Poniżej: stan rynku z ADX, zmienność jako procent ceny, wolumen względem średniej, sesja handlowa oraz drugi pięciopunktowy wynik ogólnego sentymentu. Dolny blok to ostatni sygnał, jego wejście i stop loss oraz trzy cele z odhaczeniem przy każdym osiągniętym.
Alerty
Dziewięć zdarzeń, każde z własnym przełącznikiem: kupno, sprzedaż, dowolny sygnał, silny sygnał, stop loss, trzy cele i zmiana trendu. Każde uruchamia się raz na zamknięty słupek i nigdy dla historii, więc podłączenie do długiego wykresu nie powoduje ściany starych alertów. Dostawa to log cTrader, opcjonalny dźwięk i opcjonalny e-mail przez własne ustawienia cTrader.
Ustawienia
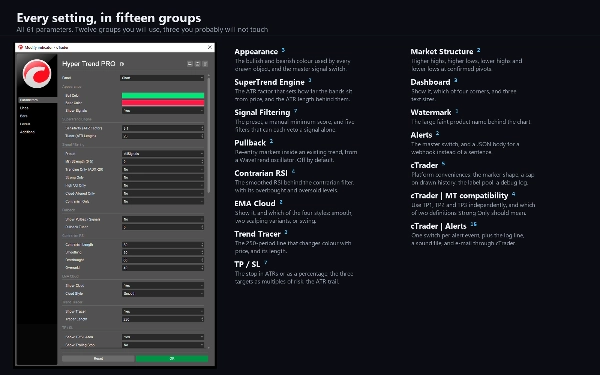
62 parametry w dwunastu grupach, których będziesz używać, oraz trzy, których prawdopodobnie nie dotkniesz. Wygląd, silnik SuperTrend, filtrowanie sygnałów, cofnięcia, kontrariański RSI, chmura, tracer, ryzyko, struktura rynku, panel kontrolny, znak wodny i alerty. Reszta to udogodnienia cTrader: tryb kolorowania świec, styl markera, limit obiektów, log debugowania, trzy przełączniki kompatybilności i jeden przełącznik na każde zdarzenie alertu.
Typ, ramy czasowe i instrumenty
Wskaźnik nakładkowy do analizy trendu i momentum. Jego najdłuższa średnia to 250 słupków, więc potrzebuje wykresu z pewną historią; M15, H1 i H4 to okno, dla którego został zaprojektowany, i działa na dowolnej ramie czasowej. Sprawdzono go na głównych parach walutowych, złocie i indeksach. Używa słupków i wolumenu: bez danych tickowych, bez głębokości rynku, bez danych zewnętrznych.
Dla kogo jest przeznaczony
Traderzy, którzy chcą sygnał trendu z oceną zamiast tak lub nie, i którzy chcą, aby stop loss i cele były ustalane w tym samym momencie co wejście, a nie później.
Wersja próbna
Wersja próbna to ta sama kompilacja z jednym ograniczeniem: działa tylko na EURUSD, akceptowane są sufiksy brokera takie jak EURUSD.i. Nie ma limitu czasowego i wszystkie parametry są dostępne. Pełna wersja dodaje wszystkie inne symbole.
Uwagi techniczne
Sygnały nie są przemalowywane. Są oceniane tylko na zamkniętych słupkach, więc znacznik nigdy nie pojawia się podczas świecy, a potem nie znika po jej zamknięciu. Kosztem tego jest jedno słupek opóźnienia i jest to celowe. Gdy transakcja jest otwarta, jej linie poziomu i ich etykiety rozszerzają się w prawo wraz z wykresem, co przesuwa rysunek, a nie poziomy.
Wskaźnik nie deklaruje żadnych praw dostępu. Nie otwiera połączenia sieciowego, nie czyta plików i nigdy nie składa, nie modyfikuje ani nie zamyka zleceń. Tiki na panelu kontrolnym rejestrują, że cena dotknęła narysowanego poziomu na załadowanej historii, bez spreadu, prowizji ani poślizgu.
Wsparcie
Pytania kieruj przez zakładkę Dyskusja tej oferty. Proszę dołączyć symbol, ramę czasową, brokera, wersję cTrader i zrzut ekranu z widocznym panelem kontrolnym.
Trading wiąże się z ryzykiem. Wyniki historyczne nie gwarantują przyszłych rezultatów.
Podsumowanie
The indicator fixes entry points, ATR-based stops, and three risk-multiplied targets at the moment a signal occurs, with optional trailing stops. Multiple filters allow users to customize signal selectivity, including trend strength, volume, cloud alignment, and contrarian RSI conditions.
Additional chart features include a configurable cloud between moving averages, a 250-period Trend Tracer line, candle tinting based on MACD strength, market structure labels, and pullback markers from a WaveTrend oscillator. A dashboard displays multi-timeframe trend direction, market state, volatility, volume, session info, sentiment scores, and trade progress.
Hyper Trend PRO supports major currency pairs, gold, and indices, using bar and volume data without tick or external inputs. Alerts cover nine event types with controlled delivery. The indicator does not repaint and operates with a one-bar delay for signal confirmation. It requires no special access rights or order execution capabilities.





























