
TwoSMA PRO
Wskaźnik
Wersja 1.0, Jan 2026
Windows, Mac
4.5
Opinie: 2
Opis
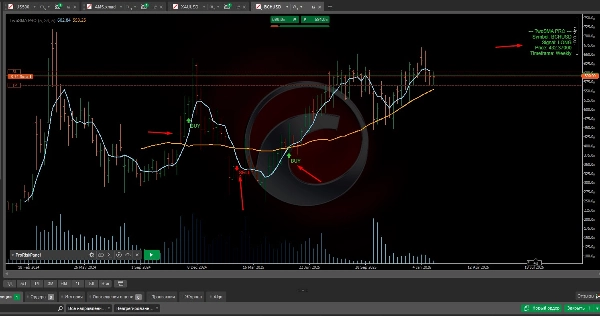
TwoSMA to wskaźnik podążający za trendem oparty na przecięciu szybkiej i wolnej średniej kroczącej SMA. Używa minimalnej odległości i filtra ATR, aby unikać rynków bocznych, podkreśla strefy bycze i niedźwiedzie oraz generuje wyraźne sygnały KUPNA i SPRZEDAŻY dla zdyscyplinowanego handlu.
Podsumowanie
Profil wskaźnika
Opinie klientów
4.5
Opinie: 2
5 | 50 % | |
4 | 50 % | |
3 | 0 % | |
2 | 0 % | |
1 | 0 % |
Opinie klientów
January 16, 2026
January 8, 2026
Is cleaner when the setup has room to breathe. Bad settings can ruin the idea.
Dyskusja
Częste pytania
Forex
Crypto
Stocks
ATR
Produkty dostępne za pośrednictwem cTrader Store, w tym boty handlowe, wskaźniki i wtyczki, dostarczane są przez deweloperów zewnętrznych i udostępniane wyłącznie w celach informacyjnych oraz w celu zapewnienia dostępu technicznego. cTrader Store nie jest brokerem i nie zapewnia doradztwa inwestycyjnego, nie udziela spersonalizowanych rekomendacji ani nie gwarantuje przyszłych wyników.
Więcej od tego autora


Cena
Od 11/01/2025
4
Sprzedaż
443
Bezpłatne instalacje