
Açıklama
IR Open Connector
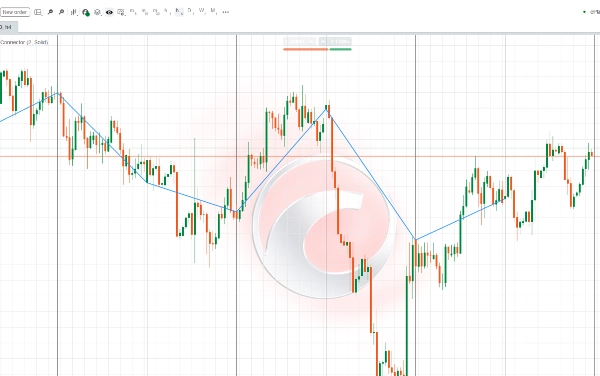
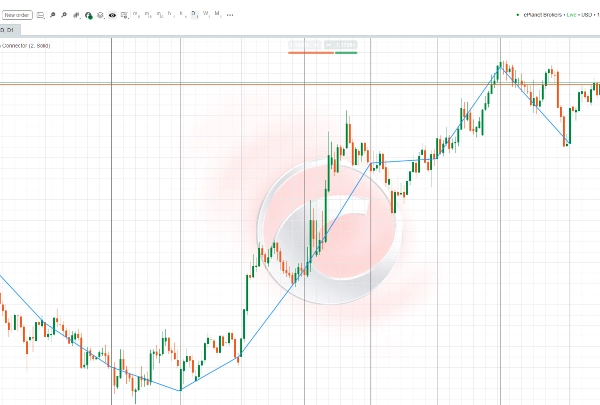
Bu gösterge, mevcut grafik zaman dilimine bağlı olarak daha yüksek zaman dilimi mumlarının açılış fiyatlarını bağlamak için tasarlanmıştır:
- Zaman dilimi bir saatten az ise → Günlük mumların açılışlarını bağlar.
- Zaman dilimi 4 saat ise → Haftalık mumların açılışlarını bağlar.
- Zaman dilimi 4 saatten büyük ama Haftalıktan küçük ise → Aylık mumların açılışlarını bağlar.
Bu, tüccarların daha yüksek dönemlerin (Günlük, Haftalık, Aylık) önemli açılış seviyelerini doğrudan grafiklerinde net bir şekilde görselleştirmelerini sağlar. Bu seviyeler genellikle kritik destek ve direnç alanları, potansiyel trend başlangıç bölgeleri ve piyasa analizinde önemli referans noktaları olarak hizmet eder.
Çizgi rengi, kalınlığı ve stili tamamen özelleştirilebilir olup, görüntüyü kişisel ticaret stilinize uyarlama esnekliği sunar.
این اندیکاتور طراحی شده تا نقاط باز شدن کندلهای تایمفریمهای بالاتر را بسته به تایمفریم فعلی شما به هم متصل کند:
- اگر تایمفریم کمتر از یک ساعت باشد → باز شدن کندلهای روزانه را به هم وصل میکند.
- اگر تایمفریم چهارساعته باشد → باز شدن کندلهای هفتگی را به هم وصل میکند.
- اگر تایمفریم بزرگتر از چهارساعته و کوچکتر از هفتگی باشد → باز شدن کندلهای ماهانه را به هم وصل میکند.
این ویژگی به معاملهگر کمک میکند تا به سادگی سطوح مهم شروع دورههای بزرگتر (روزانه، هفتگی، ماهانه) را روی نمودار مشاهده کند. این سطوح اغلب بهعنوان نقاط کلیدی حمایت و مقاومت، شروع روندهای جدید یا محدودههای معاملاتی مهم در نظر گرفته میشوند.
با تنظیم رنگ، ضخامت و نوع خط، میتوانید نمایش این خطوط را مطابق با سبک معاملاتی خود شخصیسازی کنید.


