present
Zarejestruj się i otrzymaj 50 $ zniżki na pierwszy zakup
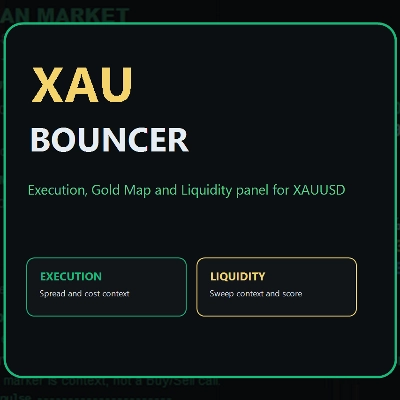
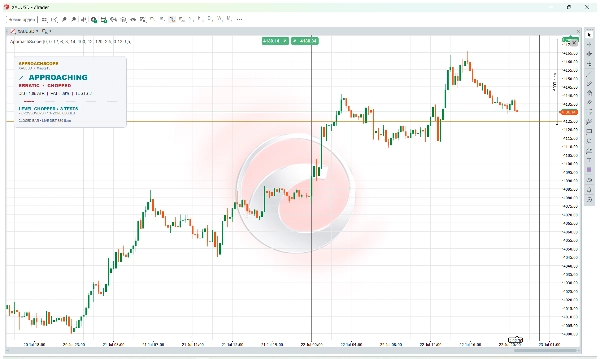
Trading product for ApproachScope Wskaźnik Key Levels ATR, image 1
ApproachScope
Wskaźnik
13 pobrania
Wersja 1.0, Jul 2026
Windows, Mac
5.0
Opinie: 1
Trading product for ApproachScope Wskaźnik Key Levels ATR, image 2
Trading product for ApproachScope Wskaźnik Key Levels ATR, image 3
Trading product for ApproachScope Wskaźnik Key Levels ATR, image 4
Trading product for ApproachScope Wskaźnik Key Levels ATR, image 5
Od 17/06/2026
94
Bezpłatne instalacje

Opis

🎯 ZOBACZ, JAK CENA DOCIERA DO TWOJEGO POZIOMU


Jeśli już oznaczasz własne poziomy wsparcia i oporu, wiesz, że sam poziom to tylko połowa historii. Ważny jest także sposób, w jaki cena do niego dociera.


ApproachScope analizuje zakończone świece wokół wybranego poziomu i przekształca ten ruch w kompaktowy panel. Otrzymujesz użyteczny kontekst do własnej decyzji handlowej, a nie kolejny niezrozumiały wskaźnik kupna lub sprzedaży.


📊 CO POKAZUJE PANEL


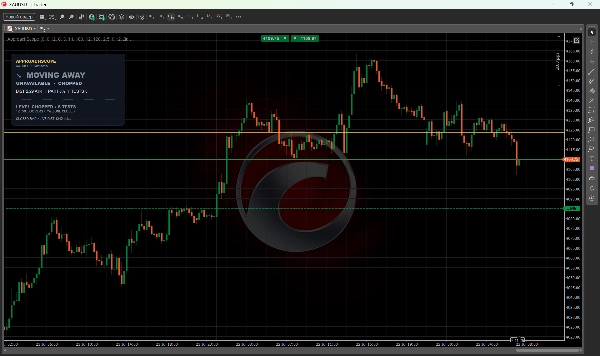
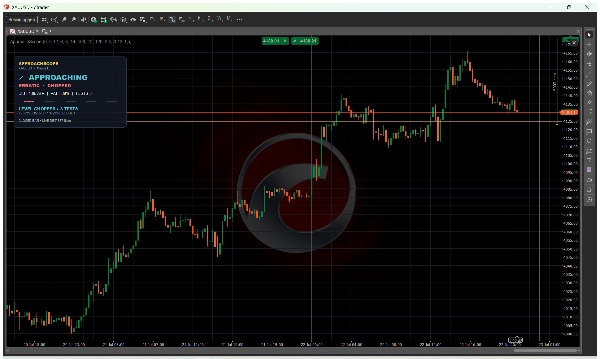
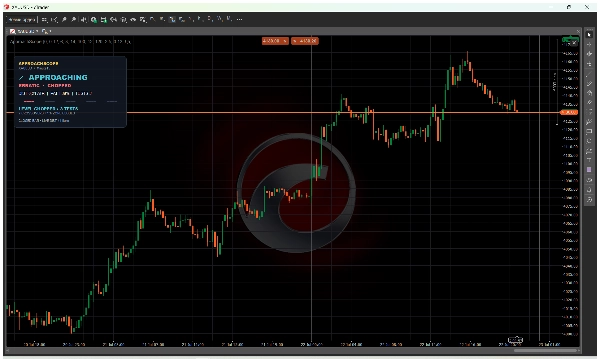
• Stan rynku: OCZEKIWANIE, ZBLIŻANIE SIĘ, NA POZIOMIE lub ODDALANIE SIĘ

• Styl podejścia: UPORZĄDKOWANY, SKOMPRESOWANY, IMPULSOWY, NIEPRZEWIDYWALNY lub MIESZANY

• Stan poziomu: ŚWIEŻY, TESTOWANY, ZUŻYTY lub ROZDRABNIANY

• Odległość w ATR, efektywność ścieżki, liczba dotknięć i aktualny spread


🛠️ JAK GO UŻYWAĆ


1. Dodaj ApproachScope do wykresu.

2. Przeciągnij bursztynową linię do swojego poziomu wsparcia, oporu, sesji, zakresu lub wyższego interwału czasowego.

3. Odczytuj panel, gdy cena zbliża się do lub oddala od tego poziomu.


Obliczenia wykorzystują zakończone świece, więc każdy stan łatwo sprawdzić na wykresie. Każda klasyfikacja zawiera także krótkie wyjaśnienie. Nie ma ukrytego wskaźnika prawdopodobieństwa.


👍 DLA KOGO JEST TO NARZĘDZIE


ApproachScope jest zaprojektowany dla dyskrecjonalnych traderów intraday, którzy już wybierają własne poziomy i chcą mieć czytelniejszy obraz podejścia. Działa z symbolami i interwałami czasowymi, które dostarczają ważne dane o cenie i skali. Obsługiwane są prefiksy i sufiksy brokera dla XAUUSD.


⚙️ USTAWIENIA


Możesz dostosować szerokość strefy ATR, minimalny rozmiar strefy, separację dotknięć, okresy ATR i linii bazowej, okresy analizy podejścia i zużycia, ostrzeżenie o spreadzie, motyw i skalę panelu.


🔒 PRYWATNOŚĆ I KONTROLA


Wskaźnik działa lokalnie w cTrader bez podwyższonych uprawnień. Nie łączy się z zewnętrznymi serwerami, nie zbiera historii konta ani nie wysyła telemetrii. Nie może otwierać, modyfikować ani zamykać transakcji.


⚠️ UWAGA


ApproachScope nie wybiera poziomów, nie generuje sygnałów kupna ani sprzedaży, nie przewiduje odbicia ani wybicia, nie oblicza prawdopodobieństwa wygranej, nie ustawia TP ani SL, ani nie ładuje wiadomości.


UPORZĄDKOWANY nie oznacza kupna ani sprzedaży. ŚWIEŻY nie gwarantuje odbicia. ROZDRABNIANY nie gwarantuje wybicia. Wyniki zależą od danych brokera, spreadu, historii i ustawień symbolu. Zawsze stosuj własne potwierdzenia i zarządzanie ryzykiem.

Podsumowanie

Podsumowanie AI
ApproachScope is a trading indicator designed to provide context on how price approaches user-defined support and resistance levels. It analyzes completed candles around a selected level and displays a compact panel with detailed information to assist discretionary intraday traders in their decision-making process.

Key features of the panel include:
- Market state classification: WAITING, APPROACHING, AT LEVEL, or MOVING AWAY.
- Approach style identification: ORDERLY, COMPRESSED, IMPULSIVE, ERRATIC, or MIXED.
- Level condition status: FRESH, TESTED, WORN, or CHOPPED.
- Quantitative metrics such as distance in ATR (Average True Range), path efficiency, touch count, and current spread.

Users add ApproachScope to their chart and position an amber line on their chosen level (support, resistance, session, range, or higher timeframe). The indicator uses completed bars for calculations, ensuring transparency and easy verification against the chart. Each classification includes explanatory notes without relying on hidden probability scores.

Settings allow customization of ATR zone width, minimum zone size, touch separation, lookback periods, spread warnings, theme, and panel scale. The indicator operates locally within cTrader, does not connect to external servers, and does not execute trades. It supports symbols and timeframes with valid price and scale data, including broker prefixes and suffixes for XAUUSD.
Profil wskaźnika

Opinie klientów

5.0
Opinie: 1
5
100 %
4
0 %
3
0 %
2
0 %
1
0 %
Opinie klientów
August 17, 2026
This one gives me clear context on how price reaches my levels without any arrows, signals and all that, just useful data like ATR distance and touch count. It's compact and doesnt clutter the chart, a no-brainer addition to my setup

Dyskusja

Częste pytania

Key Levels
ATR
Support & Resistance
Produkty dostępne za pośrednictwem cTrader Store, w tym boty handlowe, wskaźniki i wtyczki, dostarczane są przez deweloperów zewnętrznych i udostępniane wyłącznie w celach informacyjnych oraz w celu zapewnienia dostępu technicznego. cTrader Store nie jest brokerem i nie zapewnia doradztwa inwestycyjnego, nie udziela spersonalizowanych rekomendacji ani nie gwarantuje przyszłych wyników.

Więcej od tego autora

Wskaźnik
ATR
Key Levels
+5
Gold chart overlay for XAUUSD: sessions, ADR zones, round levels, spread panel and sweep marks.
Wskaźnik
Key Levels
Liquidity Grab
+2
A practical XAUUSD workspace for mapped levels, session context, liquidity events, alerts and risk planning.
Wskaźnik
Volume
Account-wide discipline HUD that explains tilt patterns and compares Clean versus Flagged P&L in real time.

Możesz także polubić

Wskaźnik
Breakout
Institutional Flow Radar scans the chart for abnormal volume events and classifies them into two groups: Capital &Public
Wskaźnik
Key Levels
Order Block
+2
It monitors trend lines on price charts and fires multi-channel alerts and optionally places trades when price crosses..
Wskaźnik
Volume
Fibonacci
+3
Draw and manage multiple fixed-range volume profiles with persistent levels, developing POC/VA and smart alerts.
Wskaźnik
AI
ATR
+27
Market Cipher B
Wskaźnik
Indices
Commodities
The Advanced CCI & EMA Indicator combines the CCI with 40 & 80 EMA logic to generate precise arrows signaling direction
Wskaźnik
Pin Bar
Inducement
+5
Institutional Nasdaq Session Liquidity Map with Live Point HUD, Sweep Alerts & Interactive Playbook.
Wskaźnik
ATR
Prop
+14
Optimize exits with Chandelier Exit! Visualize stop-loss points dynamically for improved trading precision and safety.
Wskaźnik
ATR
Signal
+2
Visual Trend Momentum is a MA/ATR/Volume trend tool. Visual signals for strong trends & reversals. Customizable. 📈📉
Wskaźnik
Key Levels
AI-assisted
+1
Draggable candle-close countdown timer with sound alert. Works on any timeframe and symbol. Cloud & Desktop ready.
Wskaźnik
AI
RSI
+7
EMA MTF TREND PRO - Multi-timeframe trend analysis overlay indicator, 6 timeframes - in one table with ADX
Wskaźnik
Volume
Liquidity Sweep
+1
Liquidity Profiler Tools
Wskaźnik
ATR
RSI
+5
Delta RSI Candle Pro, the indicator that transforms ordinary candlesticks into powerful momentum visualizers.
Wskaźnik
ATR
Channel
+3
Catch trend with precision. BUY/SELL arrows, real-time dashboard, sound alerts and ATRchannel. Works on all markets.
Wskaźnik
BOS
Volume
+5
20/40/60-day IPDA lookback ranges, Premium/Discount/Equilibrium zones, and quarterly shift alerts — anchored to true dai
Wskaźnik
ATR
RSI
+7
SSL Channel: Tracks trends 📈 measures volatility ⚡filters noise via ATR+SSL. Clear signals for precise entries/exit...
Wskaźnik
[Hamster-Coder] Pivot Points (Multi Time Frame)
Wskaźnik
ATR
RSI
+6
Market structural patterns , specifically the concepts of Change of Character (ChoCH) 🔄 and Break of Structure (BoS) 💥
Wskaźnik
Forex
EURUSD
+3
ATR-normalized MA slope in degrees, comparable across all instruments. Color-coded labels flag strong trend moves.

Cena

Od 17/06/2026
94
Bezpłatne instalacje