
Opis
Skaner Trendów Wielookresowych – Przeczytaj Pełną Historię Rynku Na Pierwszy Rzut Oka
Skaner Trendów Wielookresowych daje Ci czysty, zwarty widok trendu w wielu ramach czasowych bezpośrednio na wykresie cTrader – od M5 do D1 – plus wyraźne ogólne nastawienie handlowe:
➡️ Silny KUPUJ / KUPUJ / NEUTRALNY / SPRZEDAJ / Silny SPRZEDAJ
Zamiast przeskakiwać między wykresami i zgadywać, otrzymujesz uporządkowaną mapę trendów wielookresowych w jednym miejscu.
🧠 Inteligentny Silnik Oceny Trendu
Dla każdej włączonej ramy czasowej (M5, M15, M30, H1, H4, D1) wskaźnik oblicza solidną ocenę trendu, wykorzystując trzy kluczowe składniki:
- 📈 EMA (kierunek i nachylenie trendu)
-
- Cena względem EMA (powyżej/poniżej)
- Nachylenie EMA (rosnące/opadające)
- 💪 RSI (momentum)
-
- Normalizowane wokół poziomu 50
- 🌊 ATR (opcjonalny filtr zmienności)
-
- Opcjonalnie ignoruj warunki ultra-niskiej zmienności
Każda rama czasowa otrzymuje ocenę w zakresie -100 do +100, która następnie jest tłumaczona na prosty stan:
- 🟢 W GÓRĘ – nastawienie bycze
- 🔴 W DÓŁ – nastawienie niedźwiedzie
- 🟡 BOK – boczny / niejasny
Natychmiast widzisz, które ramy czasowe się zgadzają i gdzie jest prawdziwe kierunkowe nastawienie.
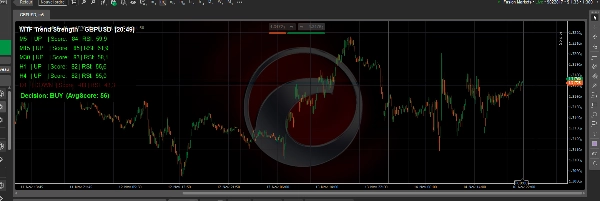
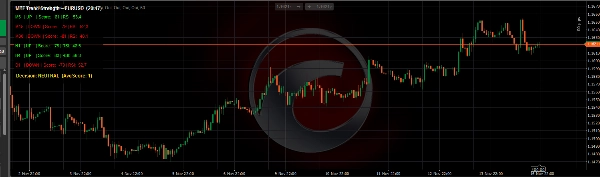
📊 Czysty, Lekki Panel na Wykresie
Narzędzie rysuje mały panel UI na górze wykresu, zaprojektowany tak, aby był czytelny, ale nieinwazyjny:
- Jedna linia na ramę czasową, na przykład:
M15 | W GÓRĘ | Wynik: 63 | RSI: 61.2 - Kolorowane:
-
- Zielony dla W GÓRĘ
- Czerwony dla W DÓŁ
- Złoty dla BOK
- Panel może być umieszczony w lewy górny lub prawy górny rogu
- Panel regulowany:
-
- Kolor tła i przezroczystość
- Rozmiar czcionki
- Wysokość linii
- Kolory bycze / niedźwiedzie / neutralne
Idealne dla skalperów, day traderów i swing traderów, którzy chcą szybko potwierdzić szerszy obraz.
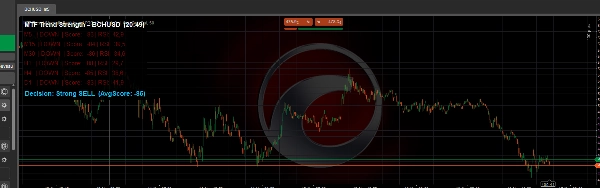
🧭 Globalna Linia Nastawienia Handlowego
Na dole panelu Skaner Trendów Wielookresowych oblicza średnią ocenę wszystkich aktywnych ram czasowych i przekształca ją w wyraźne globalne nastawienie:
- ✅ Silny KUPUJ – silna bycza zgodność między ramami czasowymi
- ✅ KUPUJ – nastawienie bycze, ale nie ekstremalne
- ⚪ NEUTRALNY – rynek mieszany lub niestabilny
- ❌ SPRZEDAJ – nastawienie niedźwiedzie
- ❌ Silny SPRZEDAJ – silna niedźwiedzia zgodność
To czyni go idealnym jako filtr trendu i kierunku dla:
- Ręcznego handlu (handluj tylko w kierunku nastawienia)
- Wejść skalpingowych z potwierdzeniem wyższej ramy czasowej
- Handlu swingowego zgodnego z H1 / H4 / D1
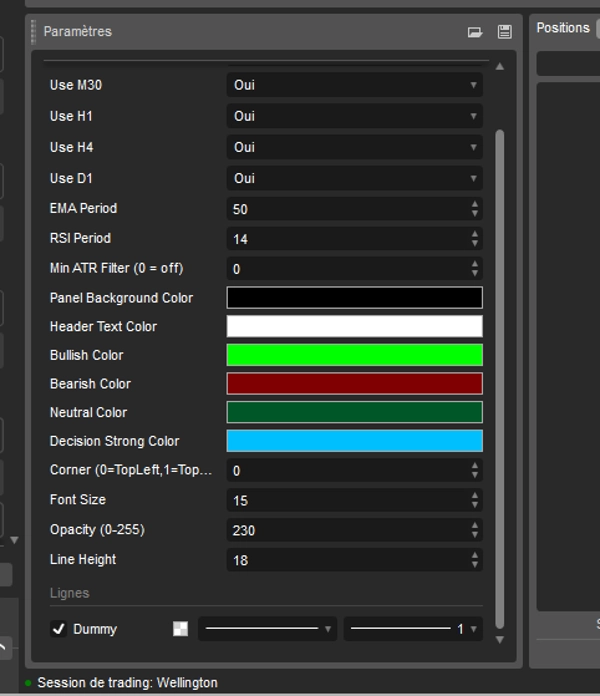
🔧 W pełni konfigurowalny
Masz pełną kontrolę nad logiką i wyglądem:
- Włącz/wyłącz każdą ramę czasową (M5, M15, M30, H1, H4, D1)
- Konfiguruj:
-
- Okres EMA (czułość trendu)
- Okres RSI (zachowanie momentum)
- Minimalny filtr ATR (0 = wyłączony)
- Ustawienia wizualne:
-
- Kolor tła panelu i przezroczystość
- Kolory nagłówka i tekstu linii
- Kolory bycze / niedźwiedzie / neutralne / silne nastawienie
- Rozmiar czcionki i odstępy między liniami
Wskaźnik działa na dowolnym symbolu obsługiwanym przez cTrader: forex, indeksy, złoto, kryptowaluty, akcje.
Jeśli chcesz jasny, obiektywny i wizualny sposób odczytu zgodności trendów w wielu ramach czasowych i szybkiego zdecydowania, czy rynek jest lepszy do kupna, sprzedaży czy pozostania z boku, Skaner Trendów Wielookresowych jest potężnym dodatkiem do Twojego zestawu narzędzi cTrader.
Podsumowanie
The indicator displays a compact, color-coded dashboard on the chart, showing one line per timeframe with trend status, score, and RSI value. Users can customize the panel’s position, colors, font size, and which timeframes to include. A global trading bias line at the bottom summarizes the average score across timeframes into five bias states: Strong BUY, BUY, NEUTRAL, SELL, and Strong SELL. This feature supports manual trading, scalping, and swing trading by providing clear directional guidance.
Multi Timeframe Trend Scanner works on any cTrader-supported symbol, including forex, indices, commodities, cryptocurrencies, and stocks. It is designed to help traders quickly assess trend alignment and market bias in a single, easy-to-read interface.
Opinie klientów
5 | 100 % | |
4 | 0 % | |
3 | 0 % | |
2 | 0 % | |
1 | 0 % |


![Logo „[Stellar Strategies] Ultimate Trend & Momentum Dashboard”](https://cdn.ctrader.com/image/webp/e9a9c9e9-4b6c-4bc0-9988-4c4768a23b6c_30290)


