
Opis
Opis produktu: BullMoon Performance Panel
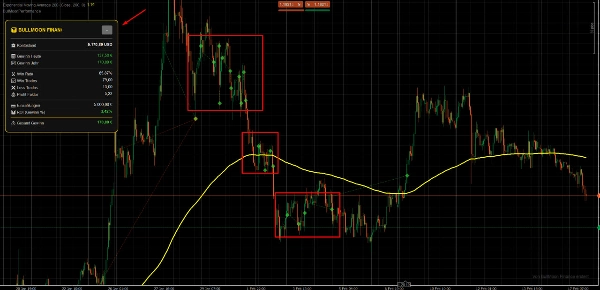
The BullMoon Performance Panel to potężne narzędzie analityczne dla cTrader, zaprojektowane, aby pomóc traderom monitorować ich wyniki w czasie rzeczywistym i wizualnie odtwarzać przeszłe transakcje bezpośrednio na wykresie.
1. Dane rynkowe i warunki
Panel analizuje Twoje dane handlowe związane z kontem oraz historyczne dane cenowe wybranego symbolu.
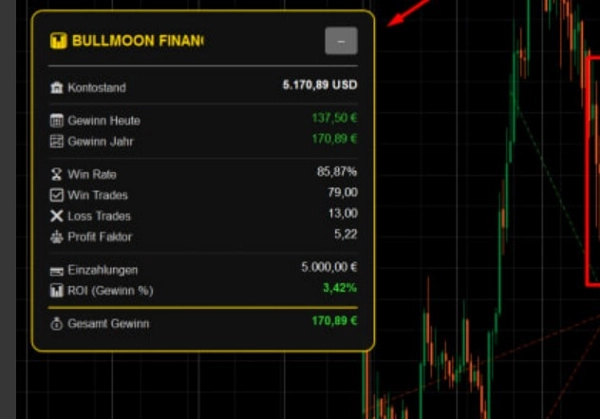
- Ocena obejmuje zarówno zamknięte, jak i otwarte transakcje, aby obliczyć kluczowe wskaźniki, takie jak zysk netto, obsunięcie kapitału oraz wskaźnik wygranych.
- Wskaźnik przeszukuje Twoją historię, aby precyzyjnie zlokalizować punkty wejścia i wyjścia.
2. Interpretacja sygnałów i elementów wizualnych
Aby analiza była jak najbardziej intuicyjna, narzędzie wykorzystuje czytelne oznaczenia wizualne bezpośrednio na wykresie:
- Symbole: Wejścia i wyjścia oznaczone są specyficznymi symbolami (np. strzałkami lub kropkami), co pozwala natychmiast zobaczyć, gdzie pozycja została otwarta i zamknięta.
- Linie wizualne: Linie łączące te symbole ilustrują czas trwania transakcji, czyniąc fazy zysku lub straty wizualnie namacalnymi.
- Panel kontrolny: Kompaktowy panel na ekranie dostarcza twardych danych, w tym zysk w USD, łączną liczbę lotów oraz współczynnik R.
3. Kluczowe ustawienia i parametry
Możesz dostosować panel do swojego specyficznego stylu handlu:
- Okres historii: Określ, ile dni przeszłych transakcji ma być wyświetlanych na wykresie.
- Elementy wizualne: Kolory dla transakcji zyskownych i stratnych oraz przezroczystość linii i symboli są w pełni regulowane.
- Podstawa obliczeń: Ustaw stałe rozmiary lotów lub procentowe ryzyko dla wyników statystycznych.
4. Typowe zastosowania i scenariusze handlowe
- Analiza po transakcji: Przejrzyj swój dzień handlowy, aby upewnić się, że prawidłowo stosowałeś swoją strategię.
- Optymalizacja strategii: Wizualnie zidentyfikuj, czy poziomy Take Profit lub Stop Loss są konsekwentnie ustawione zbyt ciasno lub zbyt szeroko.
- Monitorowanie na żywo: Śledź swoje bieżące dzienne wyniki bez konieczności przełączania się między zakładką historii konta.
5. Docelowa grupa odbiorców (wielkość konta i doświadczenie)
- Poziom doświadczenia: Odpowiedni dla początkujących, którzy chcą lepiej wyczuć swoje transakcje, jak również profesjonalistów, którzy potrzebują szybkiego wizualnego sprawdzenia wyników.
- Wielkość konta: Odpowiedni dla każdego rozmiaru konta. Szczególnie cenny dla traderów prowadzących jednocześnie wiele strategii, którzy muszą utrzymać przejrzysty przegląd.
6. Ważne ograniczenia i uwagi dotyczące użytkowania
- Platforma: Opracowany wyłącznie dla cTrader.
- Dostępność danych: Wyświetlanie historycznych transakcji zależy od dostępności danych w historii konta cTrader.
- Nie jest generatorem sygnałów: Proszę zauważyć, że ten panel jest narzędziem analitycznym i nie generuje niezależnych sygnałów kupna ani sprzedaży.
Podsumowanie
Opinie klientów
5 | 100 % | |
4 | 0 % | |
3 | 0 % | |
2 | 0 % | |
1 | 0 % |


![Logo „[Stellar Strategies] Market Session Ultimate”](https://cdn.ctrader.com/image/webp/61ffd537-0125-4246-9e72-42eca1791d64_28232)

