
说明
概述
该指标实现了Alfred François Tagher在2024年2月《股票与商品技术分析》杂志中发表的“通过价格和时间过滤识别趋势”方法。
该概念结合了价格行为和基于时间的过滤,以减少市场噪音并识别持续趋势。指标不会对每一次价格变动做出反应,只有当价格收盘超出前一周期的范围时才改变趋势方向——这一条件表明是真正的动量,而非随机波动。
核心规则
原始规则很简单:
- 如果本周期收盘价超过前一周期最高价 → 趋势为上涨
- 如果本周期收盘价低于前一周期最低价 → 趋势为下跌
- 趋势保持不变,直到出现反转条件
这种方法过滤掉了停留在前一周期范围内的微小价格波动,仅关注显示出承诺的突破。
工作原理
该指标将当前时间框架的收盘价与所选较高时间框架的前一周期最高价和最低价进行比较:
- 趋势向上: 当前收盘价 > 前一周期最高价
- 趋势向下: 当前收盘价 < 前一周期最低价
- 无变化: 收盘价保持在前一周期范围内
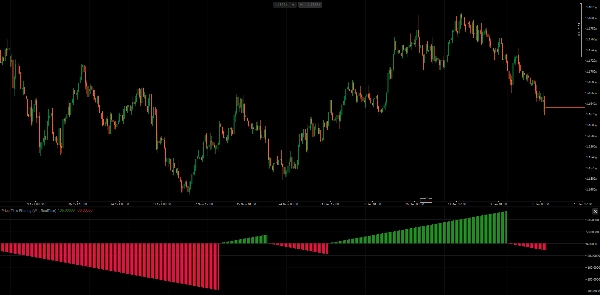
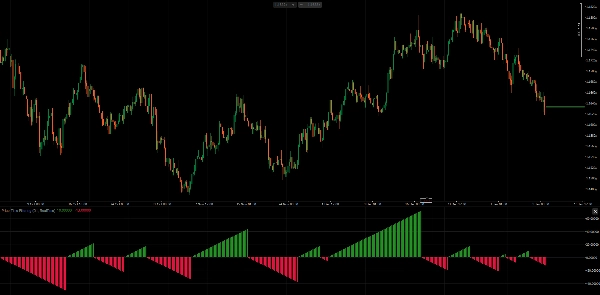
柱状图显示当前趋势方向中连续的柱数——上涨趋势为正值,下跌趋势为负值。这可视化了趋势的方向和持续时间。
过滤模式
1. PeriodEnd 模式 仅在较高时间框架周期完成时评估趋势。这与原始方法相符,其中周趋势由周五收盘价决定(月度则由月末收盘价决定)。更稳定,信号更少。
2. RealTime 模式 使用当前收盘价与前一周期范围比较,在每根柱上评估趋势。提供更早的信号,但在周期内可能产生更多噪音。
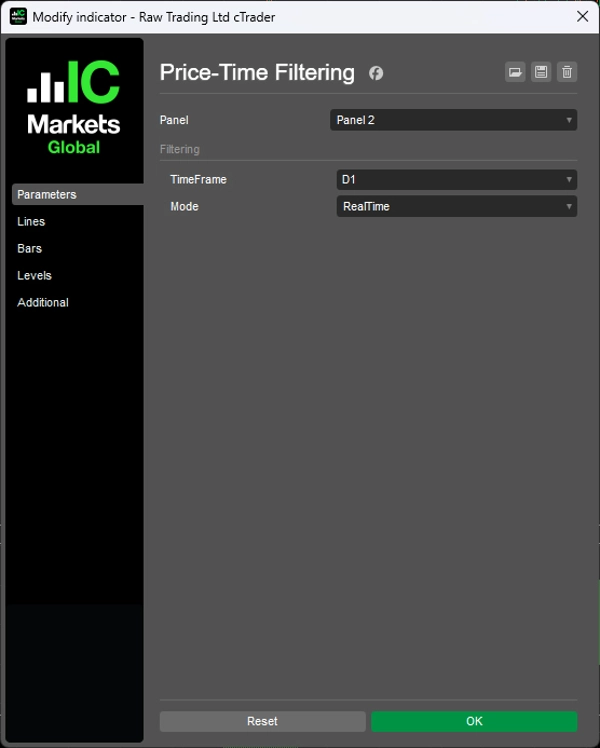
参数
- 时间框架: 用于趋势评估的较高时间框架(例如,周线,月线)
- 模式: PeriodEnd(原始方法)或 RealTime(响应式变体)
解读
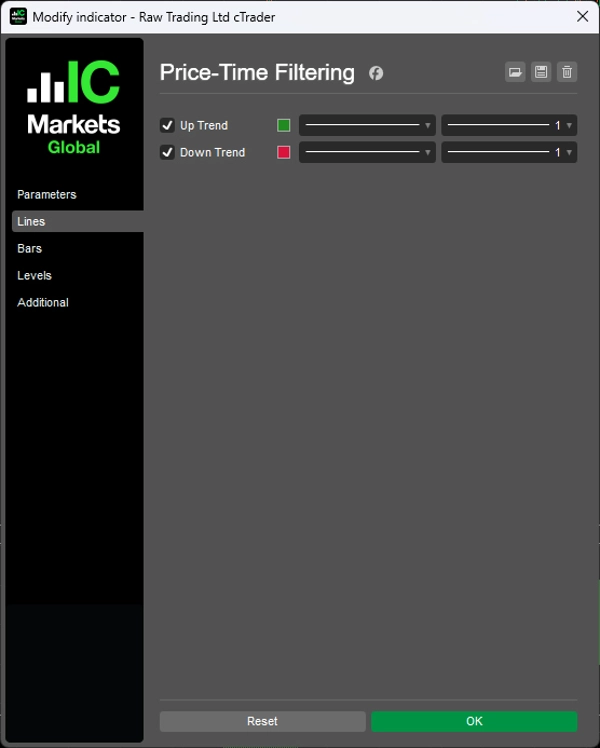
- 绿色柱状图: 上升趋势进行中,柱数显示持续时间
- 红色柱状图: 下降趋势进行中,柱数显示持续时间
- 柱状图重置: 发生趋势反转
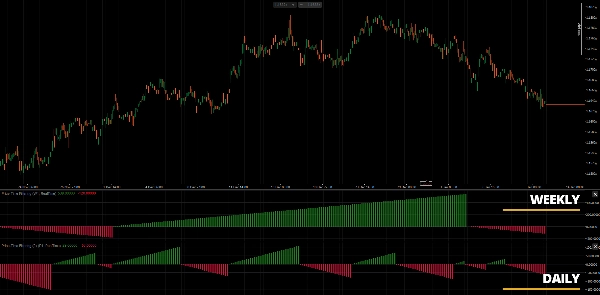
该指标在日线图上配合周线或月线时间框架选择效果最佳,如原文所述。但实现支持任何时间框架组合。
注意事项
- 最初设计用于日线图配合周/月评估
- 适用于任何所选时间框架高于图表时间框架的组合
- 柱数提供趋势成熟度的衡量——较长的计数表明趋势已建立
- 建议结合价格结构分析以确定入场时机
参考文献
Tagher, Alfred François. “通过价格和时间过滤识别趋势。”《股票与商品技术分析》,2024年2月。
__________________________________________________________________________________________
更多免费指标
探索各种市场分析工具——从结构和成交量到回归、波动率和自定义时间框架。
源代码可在GitHub 仓库获取。
全部免费使用。但如果您愿意支持咖啡费用,可以通过 这里捐助。
支撑/阻力
成交量
移动平均线
工具/自定义
基于回归
波动率
振荡器
__________________________________________________________________________________________
免责声明
交易存在风险。该指标仅用于技术分析——请始终应用适当的风险管理并负责任地交易。
反馈与改进
如果您有建议、功能请求或改进想法,请在讨论标签页留言。您的反馈有助于提升该指标,造福所有用户。
摘要
The indicator supports two filtering modes: PeriodEnd mode, which evaluates trends only at the close of a higher timeframe period (e.g., weekly or monthly), providing more stable signals; and RealTime mode, which updates trend status on every bar for more responsive but potentially noisier signals. Users can select the higher timeframe for trend evaluation, typically weekly or monthly, while applying the indicator on lower timeframe charts.
A histogram visually represents trend direction and duration, with positive values and green bars indicating uptrends, negative values and red bars indicating downtrends, and resets marking trend reversals. The indicator is applicable across various markets including Forex, indices, commodities, crypto, and stocks, and supports any timeframe combination where the selected higher timeframe exceeds the chart timeframe.


