![Trading product for [Stellar Strategies] Market Regime Filter مؤشر Forex Indices, image 1](https://cdn.ctrader.com/image/webp/3bdeba11-7e8b-4e5f-9af9-d562f48df039_28423)
[Stellar Strategies] Market Regime Filter
مؤشر
140 التنزيلات
الإصدار 1.0، Apr 2025
Windows, Mac
![Trading product for [Stellar Strategies] Market Regime Filter مؤشر Forex Indices, image 2](https://cdn.ctrader.com/image/webp/fca20c9e-045b-48d9-8a0b-c633040ed401_28424)
![Trading product for [Stellar Strategies] Market Regime Filter مؤشر Forex Indices, image 3](https://cdn.ctrader.com/image/webp/b2dbd1b3-4b93-4837-9689-192a2d53cb06_28425)
![Trading product for [Stellar Strategies] Market Regime Filter مؤشر Forex Indices, image 4](https://cdn.ctrader.com/image/webp/85c3bcad-7210-473d-a4cf-b40ce7627c83_28426)
![Trading product for [Stellar Strategies] Market Regime Filter مؤشر Forex Indices, image 5](https://cdn.ctrader.com/image/webp/988a3ea3-ac76-4434-96b0-225b162f9917_28427)
الوصف
مؤشر فلتر نظام السوق لـ cTrader
نظرة عامة:
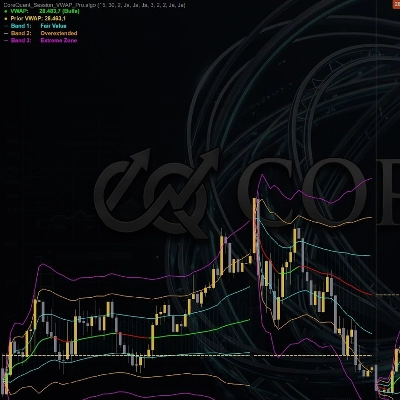
يحاول هذا المؤشر تصنيف حالة السوق الحالية أو "النظام" بناءً على مزيج من المدخلات التقنية. الغرض الأساسي منه هو مساعدة المتداولين على فهم بيئة السوق السائدة (اتجاهية، متراوحة، متقلبة) لتصفية إشارات التداول أو تعديل استراتيجيتهم وفقًا لذلك.
يقوم بتحليل:
- اتجاه وقوة الاتجاه: باستخدام المتوسطات المتحركة الأسية (EMAs) ومؤشر الاتجاه المتوسط (ADX).
- التقلب: باستخدام إما متوسط النطاق الحقيقي (ATR) أو عرض نطاق بولينجر.
- الحجم: اختياريًا باستخدام حجم التيك مقارنة بمتوسطه المتحرك لتأكيد قوة الاتجاه.
الميزات:
- حالات نظام متعددة: يصنف السوق إلى حالات مميزة:
-
- صعود قوي / هبوط قوي
- صعود ضعيف / هبوط ضعيف
- تراجع صعودي / تراجع هبوطي (حركات عكسية مؤقتة ضمن اتجاه)
- تقلب عالي في النطاق / تقلب منخفض في النطاق
- تهيئة (أثناء بدء تشغيل المؤشر)
- مقياس تقلب قابل للاختيار: اختر بين ATR أو عرض نطاق بولينجر عبر المعلمات (
مصدر التقلب). - فلتر استمرار النظام: يتطلب استمرار النظام الجديد لعدد أدنى من الأشرطة (
الحد الأدنى للأشرطة في النظام) قبل تأكيد التغيير، مما يقلل من الضوضاء. - فلتر حجم اختياري: يسمح بتصفية إشارات الاتجاه القوي بناءً على ما إذا كان الحجم أعلى بكثير من متوسطه المتحرك (
تمكين فلتر الحجم). - تنبيهات صوتية: يوفر إشعارات صوتية اختيارية (
تمكين التنبيه الصوتي) عند تغير نظام السوق المؤكد. - مخرجات الرسم البياني العمودي: يعرض النظام المؤكد الحالي كرسم بياني عمودي في نافذة المؤشر الفرعية. الارتفاع يتوافق مع القيمة الرقمية للنظام (انظر المرجع أدناه).
- تسمية نصية: يعرض اسم النظام المؤكد الحالي في الزاوية اليمنى العليا من نافذة المؤشر للرجوع السريع.
كيفية الاستخدام:
- التطبيق على الرسم البياني: أضف مؤشر "فلتر نظام السوق" إلى رسمك البياني في cTrader.
- تكوين المعلمات: اضبط معلمات الإدخال لتناسب الأداة المحددة، الإطار الزمني، وأسلوب التداول الخاص بك. تشمل المعلمات الرئيسية:
-
- فترات المتوسط المتحرك (سريع/بطيء)
- إعدادات ADX (الفترة، العتبات)
- مصدر التقلب وإعداداته (ATR/عرض بولينجر)
- الحد الأدنى للأشرطة في النظام (إعداد التأكيد)
- إعدادات فلتر الحجم (تمكين، فترة، معامل)
- إعدادات التنبيه
- تفسير الرسم البياني العمودي: يشير مستوى الرسم البياني العمودي إلى النظام المؤكد الحالي. راجع القيم الرقمية أدناه. عمومًا:
-
- القيم الأعلى (6-8): ظروف صعودية.
- القيم الأدنى (1-3): ظروف هبوطية.
- القيم المتوسطة (4-5): ظروف متراوحة.
- قيم التراجع (2، 7): حركات عكسية محتملة ضمن اتجاه أكبر.
- تصفية الإشارات: استخدم قراءة النظام كفلتر سياقي للإشارات من مؤشرات أو استراتيجيات أخرى.
-
- مثال: اعتبر فقط إشارات متابعة الاتجاه الطويلة عندما يكون النظام صعود قوي، تراجع صعودي، أو صعود ضعيف. اعتبر فقط الإشارات القائمة على النطاق (مثل انعكاسات المؤشرات) عندما تكون في تقلب منخفض في النطاق أو تقلب عالي في النطاق.
- تكييف الاستراتيجية: اضبط إدارة التداول بناءً على النظام.
-
- مثال: استخدم وقف خسارة أوسع أو دع الأرباح تستمر لفترة أطول خلال أنظمة الاتجاه القوي. اعتبر أهداف ربح أكثر إحكامًا خلال أنظمة تقلب منخفض في النطاق. كن حذرًا أثناء انتقالات النظام.
- استخدام التسمية النصية: ألق نظرة على التسمية النصية لفهم فوري للحالة الحالية.
- تمكين التنبيهات: فعّل التنبيهات الصوتية إذا كنت تريد إشعارات لتغيرات النظام.
ما يجب مراقبته:
- حساسية المعلمات: أداء المؤشر يعتمد بشكل كبير على المعلمات المختارة. الإعدادات التي تعمل جيدًا على إطار زمني أو سوق معين قد لا تعمل على آخر. يُنصح بالاختبار الخلفي والتحسين.
- التأخير: بما أن المؤشر يعتمد على المتوسطات المتحركة ومكونات متأخرة أخرى (مثل ADX)، سيتم تحديد تغيرات النظام مع بعض التأخير بعد التحول الفعلي للسوق.
- التقلبات/الانتقالات: الأسواق لا تنتقل دائمًا بسلاسة بين الأنظمة. توقع تقلبات محتملة (تقلبات سريعة ذهابًا وإيابًا) خاصة حول حدود النطاق أو عندما تضعف الاتجاهات. تساعد معلمة
الحد الأدنى للأشرطة في النظامفي تقليل ذلك لكنها لا تلغيه. - موثوقية الحجم: يستخدم فلتر الحجم حجم التيك، والذي قد لا يمثل الحجم الحقيقي للسوق، خاصة في الأسواق اللامركزية مثل الفوركس. استخدم هذا الفلتر بحذر.
- السياق مهم جدًا: يوفر هذا المؤشر رؤية واحدة للسوق. لا تستخدمه بمفرده. دائمًا اعتبر حركة السعر، مستويات الدعم/المقاومة، أنماط الرسم البياني، وربما مؤشرات أخرى للتأكيد.
- التهيئة: يحتاج المؤشر إلى عدد معين من الأشرطة التاريخية (قيمة
الأشرطة المطلوبةالمطبوعة في تبويب Automate > Log عند بدء التشغيل) لتهيئة حساباته بالكامل. تأكد من تحميل بيانات كافية على الرسم البياني الخاص بك.
قيم الرسم البياني العمودي للنظام (مرجع):
8: صعود قوي7: تراجع صعودي6: صعود ضعيف5: تقلب عالي في النطاق4: تقلب منخفض في النطاق3: هبوط ضعيف2: تراجع هبوطي1: هبوط قوي0: تهيئة
الملخص
ملخص الذكاء الاصطناعي
The Market Regime Filter indicator for cTrader classifies current market conditions into distinct regimes—such as strong/weak bull or bear trends, pullbacks, and ranging states with varying volatility—by analyzing trend direction and strength (using EMAs and ADX), volatility (via ATR or Bollinger Band Width), and optionally volume (tick volume relative to its moving average). It features a regime persistence filter that confirms changes only after a minimum number of bars to reduce noise, and an optional volume filter to validate strong trend signals. The indicator displays the confirmed regime as a histogram and a text label on the chart for quick reference, and can provide sound alerts upon regime changes. Users can configure key parameters including moving average periods, ADX settings, volatility source, minimum bars for regime confirmation, volume filter settings, and alert options. The regime reading can be used to filter signals from other indicators or adapt trade management strategies, such as adjusting stop-loss distances or profit targets based on the prevailing market environment. The indicator requires sufficient historical data to initialize and is sensitive to parameter settings, which should be optimized for each market and timeframe. It is designed to support trading across Forex, indices, and other markets.
ملف تعريف المؤشر
تقييمات العملاء
0.0
التقييمات: 0
تقييمات العملاء
لا توجد تقييمات لهذا المنتج حتى الآن. هل جرَّبته بالفعل؟ كن أول من يخبر الآخرين!
مناقشة
الأسئلة الشائعة
Forex
Indices
ATR
Bollinger
يتم توفير المنتجات المتاحة من خلال cTrader Store، بما في ذلك روبوتات التداول والمؤشرات والإضافات، من قبل مطوري الطرف الثالث وإتاحتها لأغراض الوصول المعلوماتي والفني فقط. cTrader Store ليس وسيطًا ولا يقدم نصائح استثمارية أو توصيات شخصية أو أي ضمان للأداء المستقبلي.
المزيد من هذا المؤلف
![شعار "[Stellar Strategies] Market Structure Breakout"](https://cdn.ctrader.com/image/webp/bceec265-3247-4b11-915f-6295a29c106d_28465)
![شعار "[Stellar Strategies] Market Session Ultimate"](https://cdn.ctrader.com/image/webp/61ffd537-0125-4246-9e72-42eca1791d64_28232)
![شعار "[Stellar Strategies] BOS Trend 1.0"](https://cdn.ctrader.com/image/webp/6cdec0f1-0e97-4a82-a8a4-2b67aed54d38_25695)
![شعار "[Stellar Strategies] Inside Bar with Signals"](https://cdn.ctrader.com/image/webp/1d9e8bfa-3b2c-4440-bb37-5856902008a7_30683)
![شعار "[Stellar Strategies] Wave Trend Pro"](https://cdn.ctrader.com/image/webp/5f226fbb-245a-41cd-9cdd-b018257d5e6d_28617)
![شعار "[Stellar Strategies] Smart ADX"](https://cdn.ctrader.com/image/webp/af13b084-b6f6-41db-b7bc-c7e688b57b05_36929)
![شعار "[Stellar Strategies] Linear Regression Candles 1.1"](https://cdn.ctrader.com/image/webp/8b9cff9f-2431-46d2-b0ec-c7f55f4a4a6d_27918)
![شعار "[Stellar Strategies] VBO"](https://cdn.ctrader.com/image/webp/f034c012-94d4-445a-a01b-febd1cdedaef_36944)
![شعار "[StellarStrategies] Scheduled Trade Executor"](https://cdn.ctrader.com/image/webp/daefc6af-7eca-453e-878d-1b981be2c401_25646)
![شعار "[Stellar Strategies] Candlestick Patterns Dashboard"](https://cdn.ctrader.com/image/webp/ae8691a5-4884-4553-9bcc-64e16ac82a30_38344)
![شعار "[Stellar Strategies] SP500 Gap Closure cBot 1.0"](https://cdn.ctrader.com/image/webp/92c23fdc-4ad1-4e61-bdb5-c77f6ec8c539_27686)
![شعار "[Stellar Strategies] QQE"](https://cdn.ctrader.com/image/webp/e702104a-874c-4b39-97dd-fb34518d1015_27712)


السعر
20.46M
حجم التداول
8K
الربح بالبيب
25
المبيعات
4.43K
التثبيتات المجانية