Opis
Wskaźniki Pinescriptlabs Store: 🤖Pinescriptlabs Store cBoty : (cBot) Gold & BTC BreakoutSession Pivots(nowy)
Prognoza oparta na Linreg & ATR
SmartTrend Wsparcie &
Opór
Linie
Dynamiczna
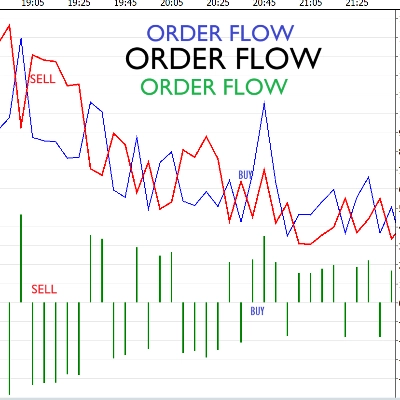
Struktura Rynku
Analiza
punktów
zwrotnych
Punktów
Fibonacci
Regresja
Liniowa
Wielookresowa
Wielopoziomowy
Tracker Kierunku Świec
Tracker
Auto
Wsparcie i
Opór
Trend
Linie
Wszystkie
Poziomy Wsparcia i
Opór
Poziomy
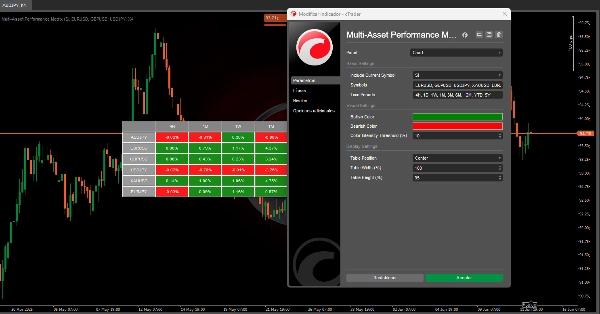
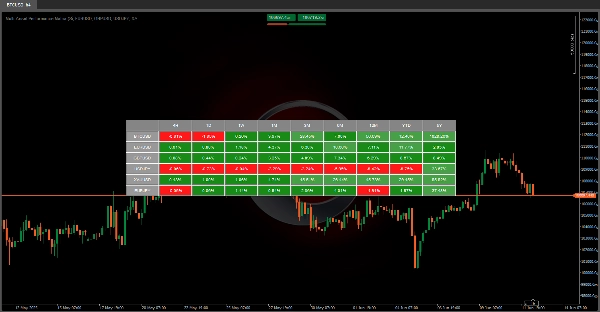
🚀 MACIERZ WIELOAKTYWOWEJ WYDAJNOŚCI 🚀
Ten algorytm to potężne narzędzie wizualne 📊 zaprojektowane do wyświetlania procentowej wydajności wielu instrumentów finansowych w różnych okresach czasu.
Przekształca dane historyczne w wydajną i intuicyjną wizualizację, pozwalając użytkownikom szybko ocenić zachowanie różnych aktywów finansowych.
❓ Co robi to narzędzie?
1️⃣ 📈 Porównuje Aktywa: Pokazuje, jak ceny różnych instrumentów finansowych (takich jak BTCUSD, EURUSD, XAUUSD, itd.) zmieniały się w czasie.
- Ramki czasowe: D (Dzienny) | 1W (Tygodniowy) | 1M (Miesięczny) | 3M (Kwartalny) | 6M (Półroczny) | 12M (Roczny) | YTD (Od początku roku) | 5Y (Ostatnie 5 lat)
2️⃣ 🎨 Podkreśla Trendy: Używa kodowania kolorami (🟢, 🔴 ) aby natychmiast zidentyfikować, które aktywa rosną lub spadają w każdym okresie.
3️⃣ ⏱️ Automatyczne Aktualizacje: Odświeża dane co minutę aby odzwierciedlić najnowsze informacje rynkowe.
💡 Dlaczego to jest przydatne?
✔ 📊 Analiza Porównawcza: Umożliwia porównania wielu aktywów obok siebie — idealne do zarządzania portfelem lub wyboru najlepiej performujących aktywów na podstawie horyzontów czasowych.
✔ 🛡️ Kontrola: Ocena spójności (lub zmienności) aktywów w różnych okresach pomaga ocenić związane z tym ryzyko.
✨ Kluczowe
✅ ⏳ Oszczędza Czas: Ręczne zbieranie i obliczanie tych danych zajęłoby godziny—to narzędzie robi to natychmiast!
✅ 👀 Wizualnie Czytelne: System kodowania kolorami ułatwia analizę, nawet dla użytkowników nietechnicznych.
✅ 🔄 Adaptowalne: Obsługuje własne symbole, dzięki czemu możesz śledzić aktywa, które są dla Ciebie ważne.
Podsumowanie
Opinie klientów
5 | 100 % | |
4 | 0 % | |
3 | 0 % | |
2 | 0 % | |
1 | 0 % |