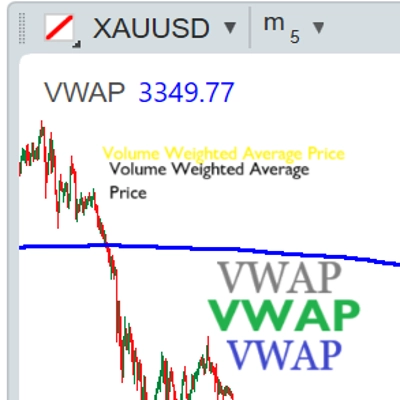
Precio Promedio Ponderado por Volumen
Wskaźnik
251 pobrania
Wersja 1.0, Jul 2025
Windows, Mac
Opis
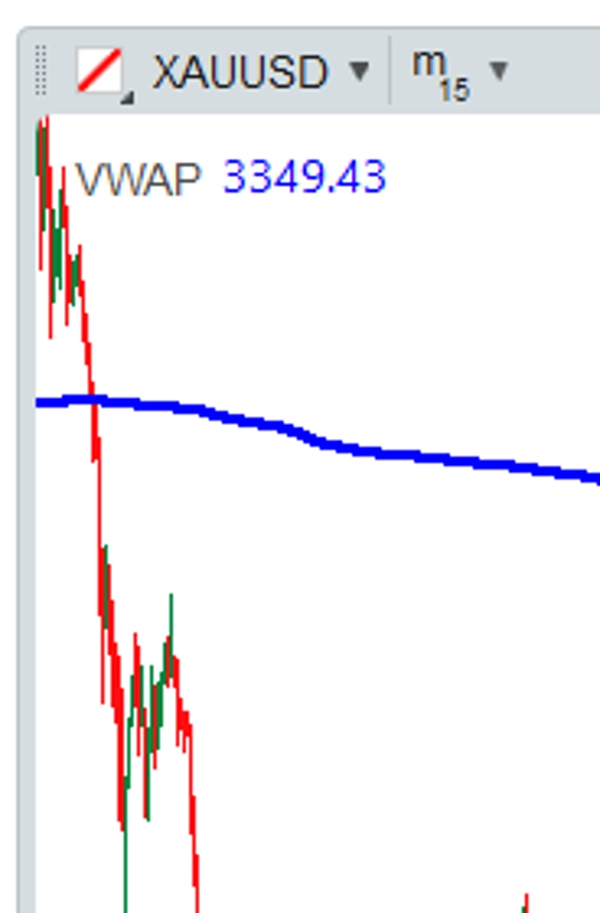
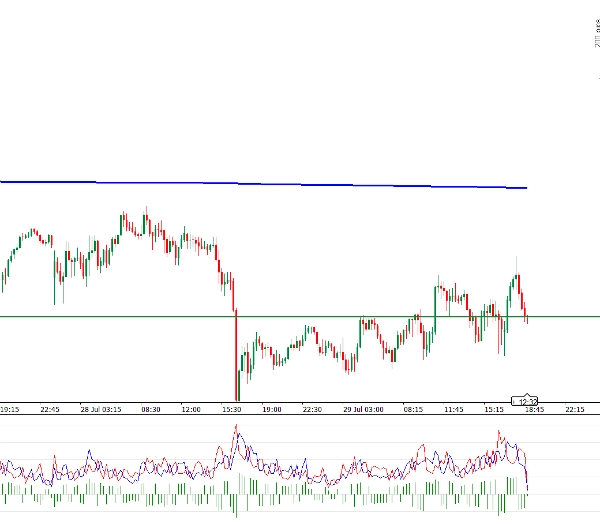
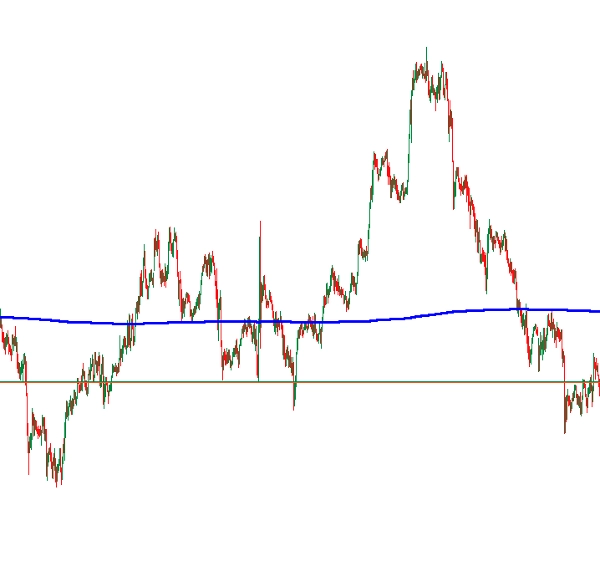
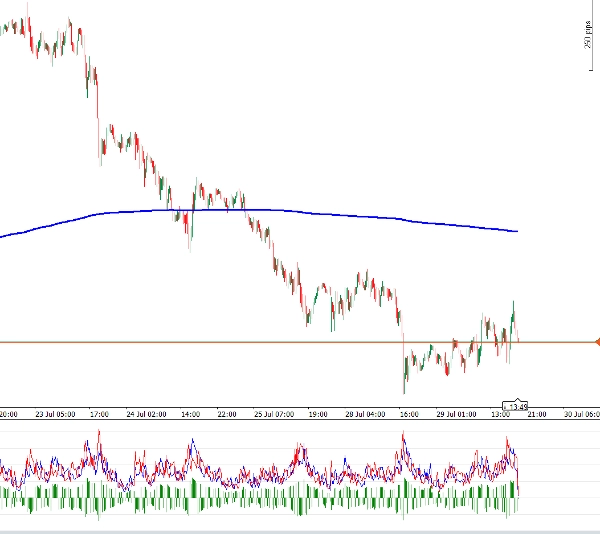
VWAP to wskaźnik techniczny, który oblicza średnią cenę aktywa ważoną jego wolumenem, przydatny do identyfikacji trendów, poziomów wsparcia/oporu oraz punktów wejścia/wyjścia.
Zasady wejścia
- Kupno (Pozycja długa):
-
- Cena przebija VWAP w górę i zamyka świecę powyżej.
- Sprzedaż (Pozycja krótka):
-
- Cena przebija VWAP w dół i zamyka świecę poniżej.
Podsumowanie
Podsumowanie AI
The Precio Promedio Ponderado por Volumen (VWAP) indicator calculates the volume-weighted average price of an asset. It helps identify market trends, support and resistance levels, and potential entry and exit points. The indicator signals a long (buy) position when the price crosses above the VWAP and closes a candle above it. Conversely, it signals a short (sell) position when the price crosses below the VWAP and closes a candle below it. This tool is used for technical analysis to support trading decisions based on price and volume dynamics.
Profil wskaźnika
Opinie klientów
0.0
Opinie: 0
Opinie klientów
Ten produkt nie ma jeszcze opinii. Wypróbowałeś(-aś) go już? Bądź pierwszy(-a) i powiedz o tym innym!
Dyskusja
Częste pytania
Produkty dostępne za pośrednictwem cTrader Store, w tym boty handlowe, wskaźniki i wtyczki, dostarczane są przez deweloperów zewnętrznych i udostępniane wyłącznie w celach informacyjnych oraz w celu zapewnienia dostępu technicznego. cTrader Store nie jest brokerem i nie zapewnia doradztwa inwestycyjnego, nie udziela spersonalizowanych rekomendacji ani nie gwarantuje przyszłych wyników.
Więcej od tego autora


Cena
412.95K
Wolumen transakcji
24.92K
Zysk w pipsach
6
Sprzedaż
648
Bezpłatne instalacje