Order Flow
Chỉ báo
253 lượt tải
Phiên bản 1.0, Jul 2025
Windows, Mac
Mô tả
Xác nhận hướng giá:
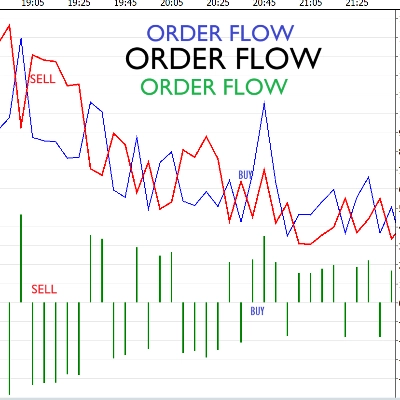
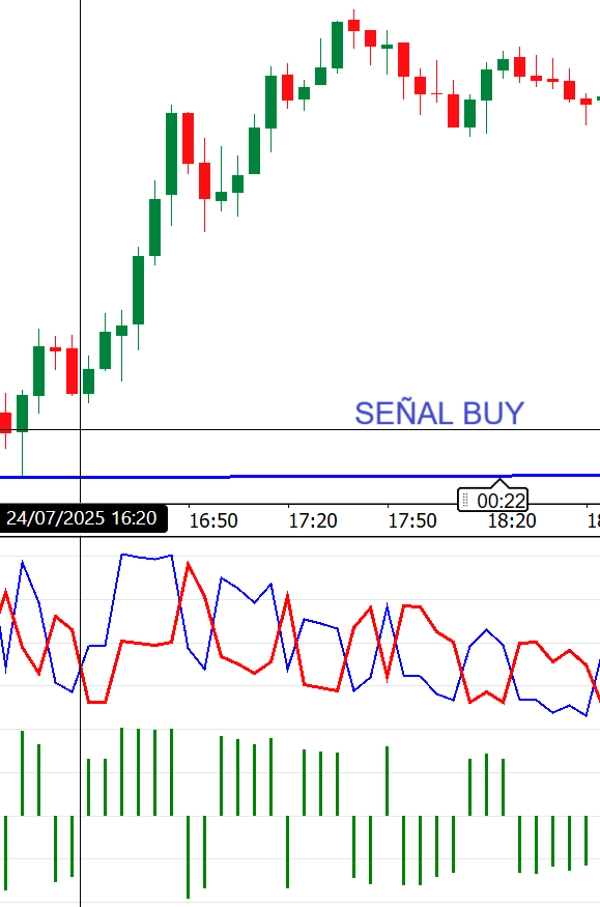
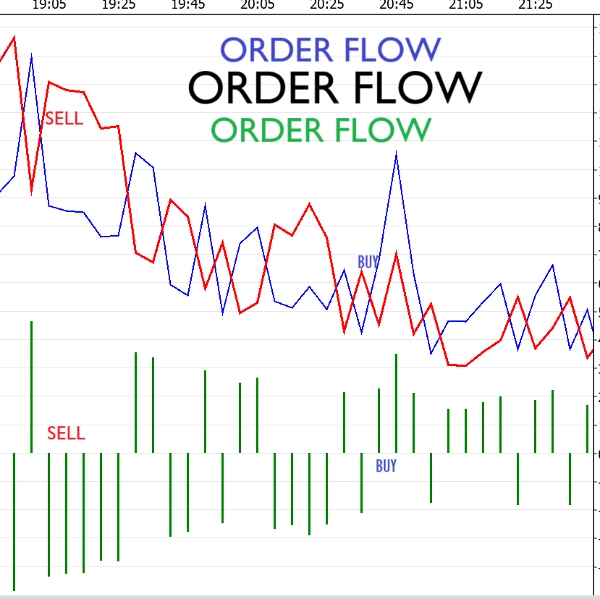
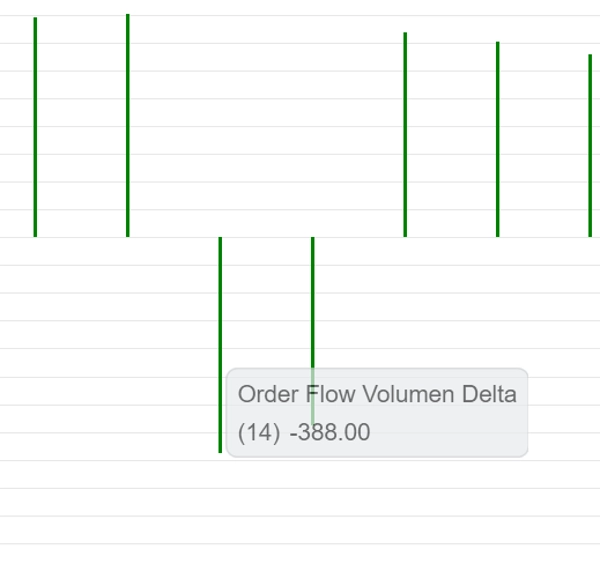
- Nếu giá đang tăng và Delta Khối lượng là dương (biểu đồ cột màu xanh lá cây trên 0), điều này xác nhận có áp lực mua, gợi ý rằng bạn có thể vào lệnh mua ("buy") để tận dụng xu hướng tăng.
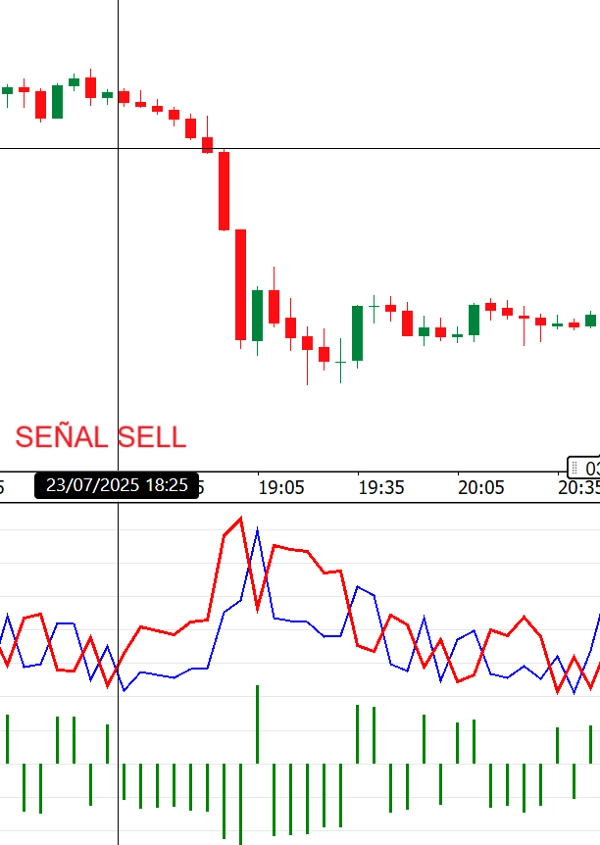
- Nếu giá đang giảm và Delta Khối lượng là âm (biểu đồ cột màu xanh lá cây dưới 0), điều này xác nhận áp lực bán, có thể là thời điểm tốt để vào lệnh bán ("sell").
Tóm tắt
Tóm tắt AI
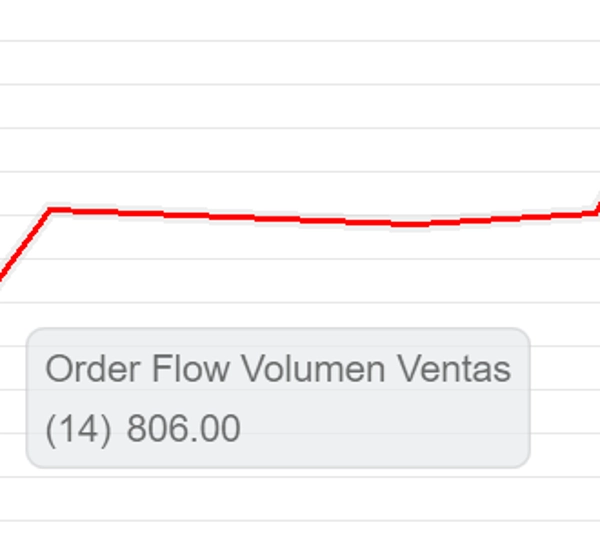
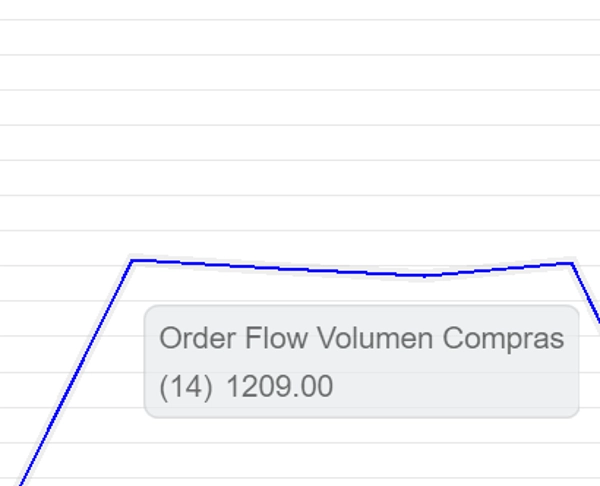
Order Flow is a volume delta indicator that visually represents order flow based on transaction volume. It displays a histogram showing the difference between buying and selling volume to help confirm price direction. When the price rises and the volume delta is positive (histogram above zero), it indicates buying pressure, suggesting a potential buy opportunity. Conversely, when the price falls and the volume delta is negative (histogram below zero), it indicates selling pressure, suggesting a potential sell opportunity. This indicator supports various markets including Forex, cryptocurrencies (e.g., BTCUSD, ETH), commodities (e.g., gold, oil), indices (e.g., NAS100, SP500), and stocks. It is tagged for use with strategies such as breakout, scalping, martingale, grid, and incorporates volume-related indicators like VWAP and Supertrend. The visual signals assist traders in confirming market momentum and making informed entry decisions based on volume-driven order flow analysis.
Hồ sơ chỉ báo
Đánh giá của khách hàng
0.0
Đánh giá: 0
Đánh giá của khách hàng
Sản phẩm này chưa có đánh giá nào. Bạn đã dùng thử chưa? Hãy là người đầu tiên chia sẻ với mọi người!
Thảo luận
Câu hỏi thường gặp
BTCUSD
Forex
Signal
Breakout
Indices
EURUSD
Commodities
GBPUSD
NZDUSD
Martingale
Prop
Scalping
Supertrend
Crypto
Grid
Stocks
XAUUSD
NAS100
USDJPY
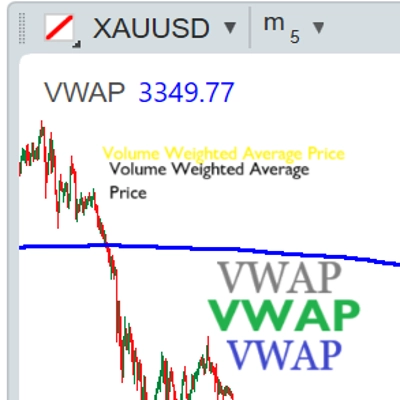
VWAP
Các sản phẩm có sẵn trên cTrader Store, bao gồm bot giao dịch, chỉ báo và plugin, được cung cấp bởi các nhà phát triển bên thứ ba và chỉ nhằm mục đích cung cấp thông tin và tiếp cận kỹ thuật. cTrader Store không phải là nhà môi giới và không cung cấp lời khuyên đầu tư, khuyến nghị cá nhân hay bất kỳ đảm bảo nào về hiệu suất trong tương lai.
Sản phẩm khác của tác giả này


Giá
412.95K
Khối lượng đã giao dịch
24.92K
Pip đạt được
6
Lượt bán
647
Cài đặt miễn phí