
PIVOT POINTS, HIGH-LOW OF THE DAY
Indikator
108 unduhan
Versi 1.0, Mar 2026
Windows, Mac
Deskripsi
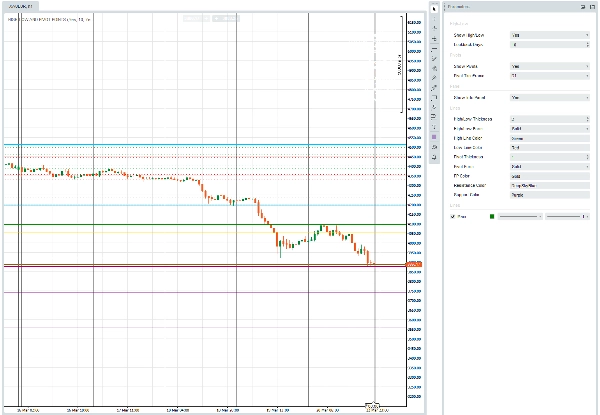
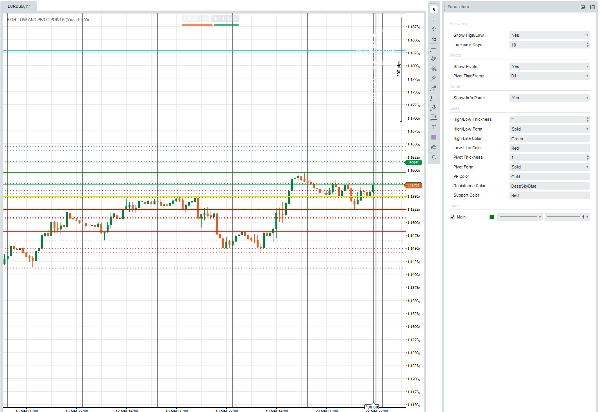
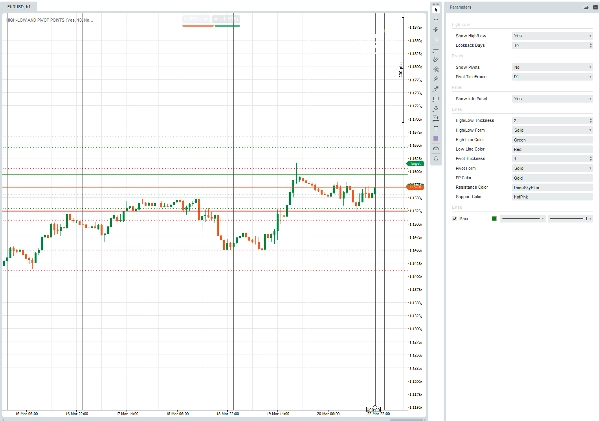
HIGH-LOW DAN TITIK PIVOT adalah indikator overlay cTrader yang menggambar level harga tertinggi/terendah harian dan titik pivot klasik langsung di grafik Anda.
Parameter sekilas:
GrupApa yang Anda kendalikan
High-Low
Tampilkan/sembunyikan garis; berapa hari sebelumnya yang ditampilkan (Lookback Days)
Pivots
Tampilkan/sembunyikan garis; kerangka waktu mana yang mengatur perhitungan pivot (Harian, Mingguan, dll.)
Panel
Tampilkan/sembunyikan kotak info di grafik yang menampilkan harga saat ini dan level pivot
Garis
Ketebalan, gaya (Solid / Dotted / VeryDotted), dan warna untuk garis High, Low, PP, Resistance, dan Support
Apa yang digambarnya:
- High/Low hari ini dengan warna pilihan Anda; hari-hari sebelumnya dalam versi yang lebih terang/lebih tipis dari warna yang sama.
- Tujuh level pivot standar — PP, R1–R3, S1–S3 — dihitung dari bar selesai sebelumnya dari kerangka waktu pivot yang Anda pilih.
- Panel info kanan atas yang merangkum High/Low Hari ini secara langsung, rentang lookback multi-hari, dan semua tujuh harga pivot.
Ringkasan
Ringkasan AI
The "Pivot Points, High-Low of the Day" indicator for cTrader overlays daily high and low price levels along with classic pivot points directly on trading charts. It visually displays today's high and low prices, as well as those from prior days based on a configurable lookback period. The indicator calculates and plots seven standard pivot levels—Pivot Point (PP), Resistance levels R1 to R3, and Support levels S1 to S3—derived from the previous completed bar of a selectable timeframe (e.g., daily or weekly). Users can customize visibility, line thickness, style (solid, dotted, very dotted), and colors for all lines including high, low, pivot, resistance, and support. An optional on-chart info panel summarizes live day high/low, multi-day range, and all pivot prices for quick reference. This tool supports multiple markets and symbols including Forex pairs (EURUSD, GBPUSD, NZDUSD, USDJPY), cryptocurrencies (BTCUSD), commodities (XAUUSD), indices (NAS100), and stocks. It is designed to assist traders in identifying key price levels and potential breakout or reversal points based on historical price data and pivot calculations.
Profil indikator
Ulasan pelanggan
0.0
Ulasan: 0
Ulasan pelanggan
Belum ada ulasan untuk produk ini. Sudah mencobanya? Jadilah pemberi ulasan pertama!
Diskusi
Pertanyaan umum
BTCUSD
Forex
Breakout
Indices
EURUSD
Commodities
GBPUSD
NZDUSD
Crypto
Stocks
XAUUSD
NAS100
USDJPY
Produk-produk yang tersedia melalui cTrader Store, termasuk bot trading, indikator, dan plugin, disediakan oleh pengembang pihak ketiga serta hanya ditujukan untuk akses teknis dan informasi. cTrader Store bukan broker dan tidak menyediakan saran investasi, rekomendasi pribadi, atau jaminan apa pun tentang kinerja di masa mendatang.
Produk lain dari penulis ini


Harga
49
Penjualan
306
Instal gratis