
AlgoCorner 1-100 Moving Averages
インジケーター
138 ダウンロード数
バージョン 1.1、Jan 2026
Windows、Mac
5.0
レビュー: 1
説明
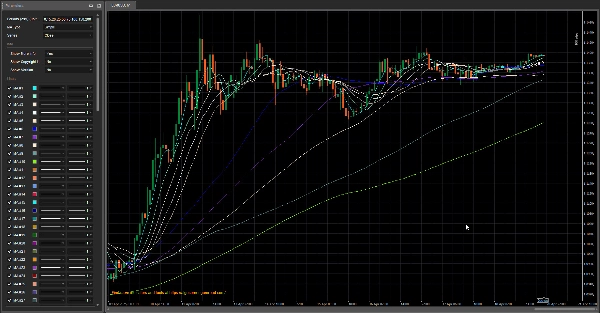
このインジケーターは、CSV(カンマ区切り値形式)で期間を入力するだけで多くの移動平均線を描画でき、最大100本の移動平均線が許可されています。
移動平均線を一つずつ追加する代わりに、この便利なツールを使って簡単に多くの移動平均線を描画できます。
それらすべて100本は完全にカスタマイズ可能です。
各移動平均線の色はアルファベット順に並べられています。
概要
インジケーターのプロフィール
カスタマーレビュー
5.0
レビュー: 1
5 | 100 % | |
4 | 0 % | |
3 | 0 % | |
2 | 0 % | |
1 | 0 % |
カスタマーレビュー
October 2, 2025
Love MAs? This tool lets you stack up to 100 on your chart! Great for trend hunting and system testing. Just don’t overload it – too many lines can turn your chart into spaghetti.
ディスカッション
よくあるご質問
Forex
Signal
Supertrend
cTrader Storeで入手可能な取引ボット、インジケーター、プラグインなどの商品は、第三者の開発者が提供するものであり、情報と技術の取得のみを目的としてご利用いただけます。cTrader Storeはブローカーではなく、投資助言や個人的な推奨を行うことも、将来のパフォーマンスを保証することもありません。
この作成者の他の商品


これも好きかも


![「[Hamster-Coder] Pivot Points MTF」ロゴ](https://cdn.ctrader.com/image/webp/4c143e5a-309c-40e3-a578-f04d1e133ffa_31159)
価格
11
販売
355
無料インストール