説明
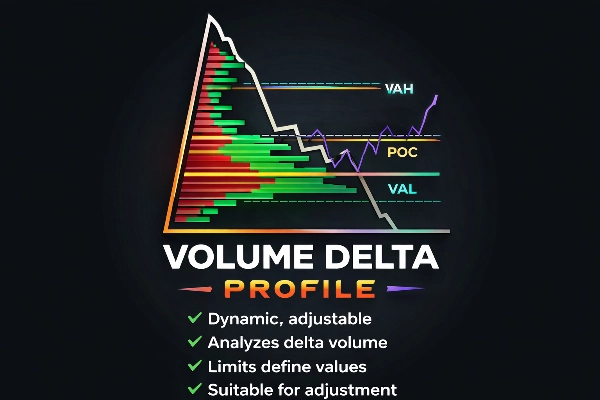
ボリュームデルタプロファイル
上級トレーダーのためのプロフェッショナルなオーダーフローインサイト
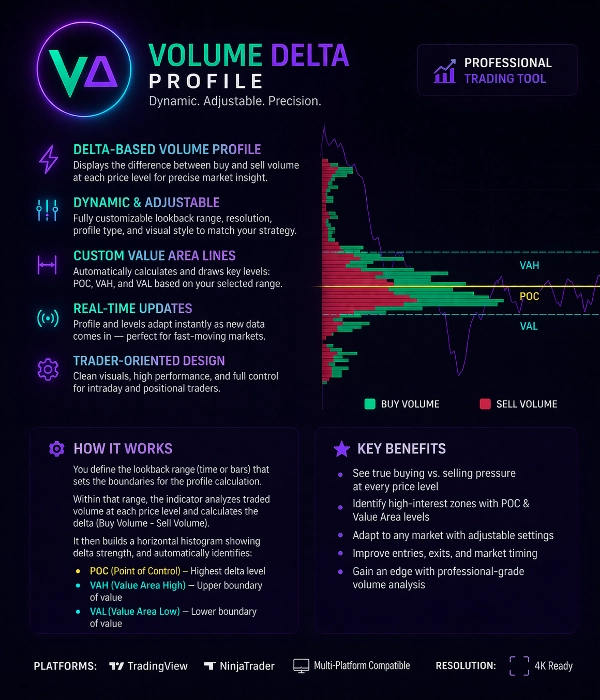
ボリュームデルタプロファイルは、各価格レベルでの買い手と売り手の真のバランスを明らかにするために設計された強力なトレーディングツールです。
従来のボリュームプロファイルとは異なり、このインジケーターはデルタボリューム(買いボリューム-売りボリューム)を分析して、積極的な市場参加者がどこで支配しているかを示します。
トレーダーが機関投資家の活動、吸収ゾーン、高関心価格レベルを正確に特定するのに役立ちます。
主な特徴
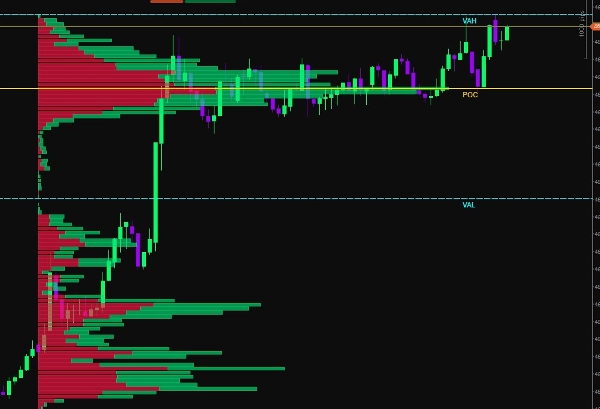
デルタベースのボリュームプロファイル
インジケーターは各価格レベルでボリュームデルタを計算し、以下を区別します:
• 積極的な買い圧力
• 積極的な売り圧力
これにより、実際に市場を支配しているのは誰かが明らかになります。
動的かつ調整可能なプロファイル範囲
プロファイルの計算範囲は完全にカスタマイズ可能です。
ユーザーは計算エリアを以下で定義できます:
• カスタムバー範囲
• セッション範囲
• 手動選択
• ローリングダイナミックレンジ
プロファイルは新しいデータが到着すると自動的に更新されます。
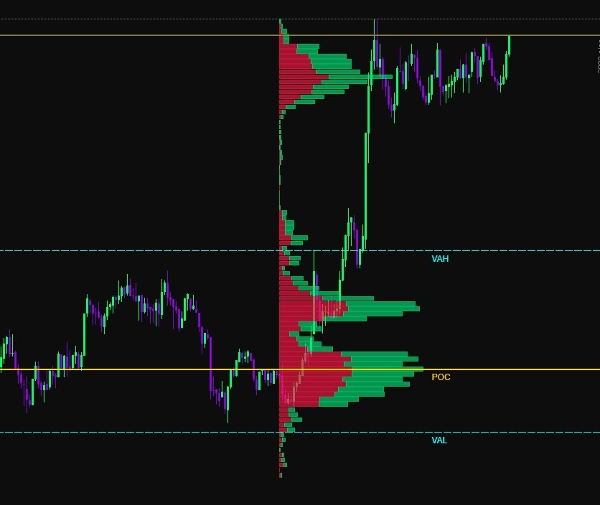
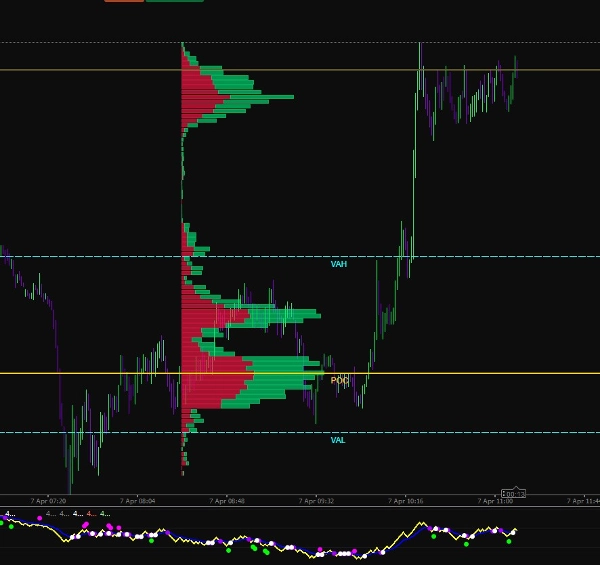
バリューエリア検出
インジケーターは主要な市場構造レベルを自動的に計算します:
POC(ポイントオブコントロール)
最も取引されたデルタボリュームの価格レベル。
VAH(バリューエリアハイ)
バリューエリアの上限。
VAL(バリューエリアロー)
バリューエリアの下限。
これらのレベルは市場活動の大部分が発生した場所を強調します。
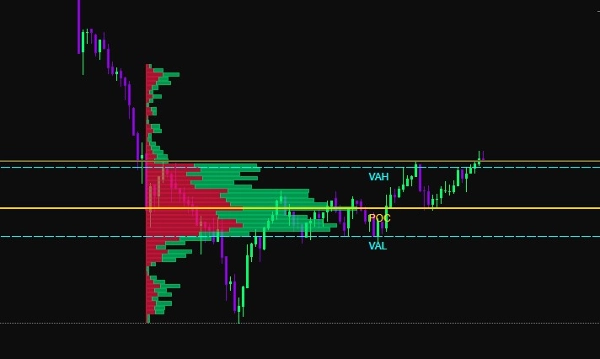
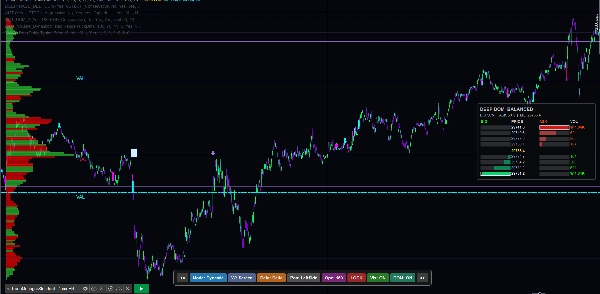
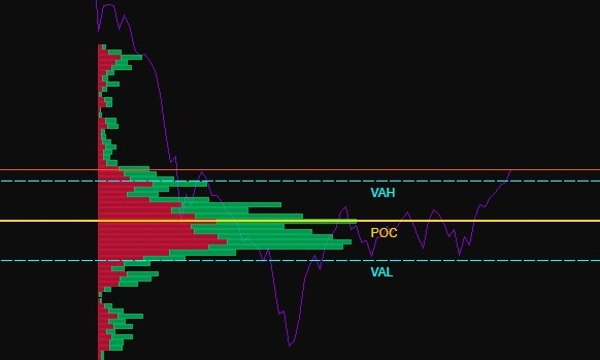
買い対売りの視覚化
ボリュームは水平ヒストグラムとして表示されます:
緑のバー → 支配的な買いボリューム
赤のバー → 支配的な売りボリューム
これによりトレーダーは即座に以下を確認できます:
• 吸収ゾーン
• 不均衡エリア
• 流動性クラスター
• 機関投資家の足跡
適応型視覚化
インジケーターには複数の視覚カスタマイズオプションが含まれています:
• ヒストグラム幅の調整
• カスタムカラースキーム
• 透明度の調整
• 解像度制御
• ズーム適応レンダリング
これにより、すべてのチャート時間枠で明確な視覚化が保証されます。
スマート境界レベル
インジケーターは動的な参照レベルを描画します:
• POCライン
• VAHライン
• VALライン
これらのレベルは選択されたプロファイル範囲に基づいて自動的に更新され、以下として使用できます:
• サポート / レジスタンス
• 平均回帰ゾーン
• ブレイクアウト確認レベル
リアルタイム計算
ボリュームデルタプロファイルはライブ市場データを使用して継続的に再計算します。
これにより、トレーダーは高速な市場でも常に最新のオーダーフロー情報を見ることができます。
使用例
このツールは以下に最適です:
• スキャルピング
• 日中取引
• 先物取引
• オーダーフロー分析
• 流動性追跡
• 機関投資家の足跡検出
主な取引上の利点
✔ 実際の買いと売りの圧力を識別
✔ 吸収および消耗ゾーンを検出
✔ 高流動性レベルを特定
✔ エントリー精度を向上
✔ ブレイクアウトや反転を確認
✔ 市場構造を理解
技術仕様
計算方法:
デルタボリューム = 買いボリューム − 売りボリューム
プロファイルタイプ:
水平価格レベルヒストグラム
自動レベル:
POC、VAH、VAL
更新モード:
リアルタイム動的更新
カスタム設定:
• プロファイル範囲
• ヒストグラム解像度
• ボリュームスケーリング
• カラー設定
• レベルの表示/非表示
プラットフォーム互換性:
高性能チャートレンダリングに最適化
プロフェッショナルトレーダー向けに設計
ボリュームデルタプロファイルは、基本的なインジケーターを超えて市場の真のメカニズムを理解したいトレーダー向けに作られています。
ボリューム分析、デルタ計算、バリューエリア構造を組み合わせることで、このツールは市場参加と流動性分布の明確な視点を提供します。
概要
Users can customize the profile calculation range using options such as custom bar range, session range, manual selection, or rolling dynamic range, with real-time updates as new market data arrives. Key market structure levels—Point of Control (POC), Value Area High (VAH), and Value Area Low (VAL)—are automatically calculated and drawn as dynamic reference lines, useful for support/resistance, mean reversion, and breakout confirmation.
Additional features include adjustable histogram width, color schemes, transparency, resolution control, and zoom-adaptive rendering for clear visualization across all chart timeframes. The tool supports use cases like scalping, intraday trading, futures trading, order flow analysis, liquidity tracking, and institutional footprint detection. It is optimized for high-performance chart rendering and aims to provide traders with precise insights into market participation and liquidity distribution.