
คำอธิบาย
ระบุโซนที่มีความสนใจจากสถาบันสูง: ที่ซึ่งมี ปริมาณมากกว่า ในช่วงพัก มี การมีส่วนร่วมมากขึ้นจากผู้เล่นรายใหญ่
• ⚖️ วัดสมดุลของอำนาจ: ดูว่า แรงกดดันซื้อหรือขาย มีอิทธิพลในแต่ละโซนราคา
• 🎯 ตรวจจับระดับสำคัญ: โซนที่มี ปริมาณการเบรกสูงกว่า มักทำหน้าที่เป็น แนวรับ/แนวต้านในอนาคต
• ✅ ยืนยันการเคลื่อนไหว: การ เบรกเอาท์ที่มีปริมาณสูง มี ความน่าจะเป็นสูงกว่าในการเป็นของแท้
https://chartshots.spotware.com/c/6941a3f65f376
📈 อ่านอย่างไร?
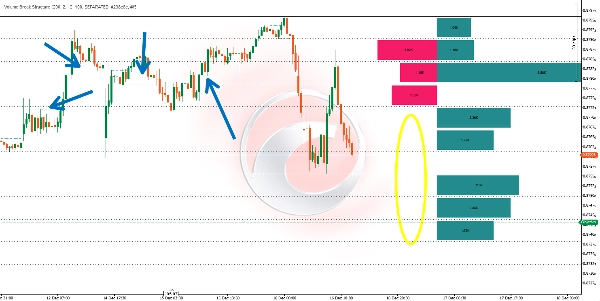
📊 เส้นแนวนอน
• แต่ละเส้นแสดงระดับที่เกิด การเบรกโครงสร้าง
• 🟢 เบรกขาขึ้น
• 🔴 เบรกขาลง
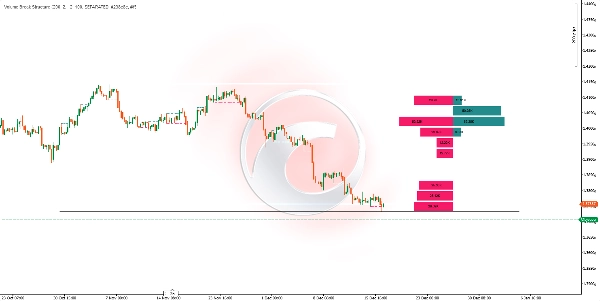
📈 ฮิสโตแกรม
• อยู่ทาง ด้านขวาของแผนภูมิ
• แบ่งออกเป็น แถวที่แสดงช่วงราคาที่เท่ากัน
• 📗 แท่งแรงกดดันผู้ซื้อ: ปริมาณสะสม ของการเบรกขาขึ้นในโซนนั้น
• 📕 แท่งแรงกดดันผู้ขาย: ปริมาณสะสม ของการเบรกขาลงในโซนนั้น
• ⬆️ ขนาดแท่ง: ขนาดใหญ่ขึ้นแสดงถึงปริมาณเบรกที่มากขึ้น ในระดับนั้น
https://chartshots.spotware.com/c/6941a4346ede0
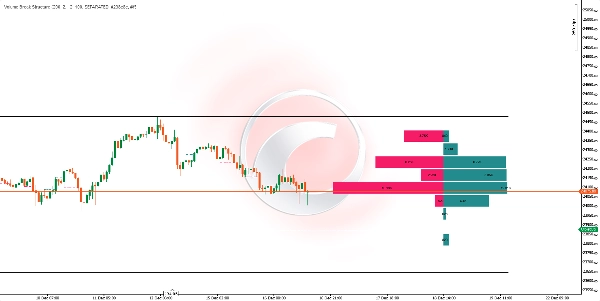
🟦 ตารางกริด
• เส้นบนและล่างที่ ทึบ แสดงช่วงสูงสุดและต่ำสุดของช่วงเวลาที่วิเคราะห์
• เส้น ประ แบ่งช่วงนั้นออกเป็นส่วนเท่าๆ กันเพื่อให้อ่านง่ายขึ้น
⚙️ 🔧 พารามิเตอร์หลัก
พารามิเตอร์ฟังก์ชัน
🕯️ แท่งคำนวณ
จำนวนแท่งเทียนที่วิเคราะห์ย้อนหลัง ย้อนหลัง
🎚️ ความยาวสวิง
ความไว สำหรับการตรวจจับจุดเปลี่ยน (สูง = สัญญาณน้อยลง แต่เชื่อถือได้มากขึ้น)
📊 แถวฮิสโตแกรม
จำนวน ส่วนแบ่ง/แถว ในฮิสโตแกรม
📏 ความกว้างฮิสโตแกรม
ความกว้างเชิงภาพ ของฮิสโตแกรม
👁️ โหมดการแสดงผล
แยกกัน (ซื้อ/ขาย) หรือ รวมกัน (ปริมาณรวม)
🔄 อัปเดตเมื่อใด?
🕒 ตัวชี้วัด คำนวณใหม่โดยอัตโนมัติเมื่อแท่งเทียนปิด รวมถึง การเบรกโครงสร้างใหม่ ที่เกิดขึ้น
💡 🤝 วิธีการผสมผสาน?
📈 กับการวิเคราะห์แนวโน้ม
• ใน แนวโน้มขาขึ้น ให้มองหาโซนที่ ปริมาณแรงกดดันซื้อมีอำนาจเหนือกว่า เพื่อโอกาสเข้าซื้อในช่วง การดึงกลับ
• ใน แนวโน้มขาลง ให้มองหาโซนที่ ปริมาณแรงกดดันขายมีอำนาจเหนือกว่า เพื่อโอกาสเข้าซื้อในช่วง การเด้งตัว
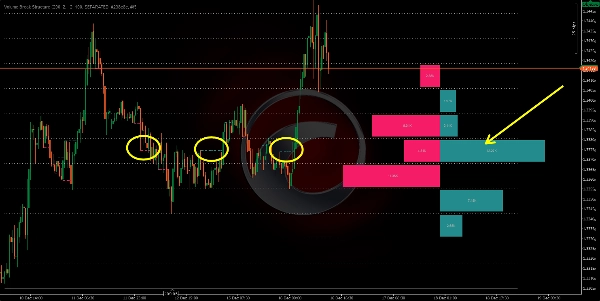
🛡️ กับแนวรับและแนวต้าน
• ระดับที่มี ปริมาณการเบรกสูงสุด มักกลายเป็น โซนปฏิกิริยาในอนาคต
• ใช้ฮิสโตแกรมเพื่อระบุโซนที่ได้รับการ "ปกป้อง" โดยผู้ซื้อหรือผู้ขาย
🌊 กับการไหลของคำสั่ง
• ยืนยัน การอ่านฮิสโตแกรมด้วยเครื่องมือ การไหลของคำสั่งแบบเรียลไทม์
• โซนที่มีปริมาณเบรกสูงมักตรงกับ พื้นที่ดูดซับของสถาบัน
🕯️ กับการเคลื่อนไหวของราคา
• มองหารูปแบบแท่งเทียนในโซนที่ฮิสโตแกรมแสดง ความไม่สมดุลอย่างมีนัยสำคัญ
• รูปแบบกลับตัวในโซนที่มี แรงกดดันซื้อสูง มี ความน่าจะเป็นสำเร็จสูงกว่า
🎯 🚀 การตีความอย่างรวดเร็ว
สัญญาณภาพการตีความ
📗 แท่งผู้ซื้อใหญ่, 📕 แท่งผู้ขายเล็ก
โซนความต้องการสูง, อาจเป็น แนวรับ
📕 แท่งผู้ขายใหญ่, 📗 แท่งผู้ซื้อเล็ก
โซนอุปทานสูง, อาจเป็น แนวต้าน
⚔️ แท่งทั้งสองใหญ่และคล้ายกัน
โซนการต่อสู้, ความผันผวนสูง ที่คาดการณ์ไว้
⏭️ แถวที่ไม่มีแท่ง
โซนที่มีความสนใจน้อย, ราคาผ่านอย่างรวดเร็ว
ข้อควรพิจารณาสำคัญ
• ❌ ตัวชี้วัด ทำงานกับข้อมูลประวัติที่ได้รับการยืนยัน; ไม่ได้ทำนายอนาคต
• 📊 จำนวนแท่งคำนวณที่มากขึ้น = มุมมองที่กว้างขึ้น แต่สามารถ เจือจางสัญญาณล่าสุด
• ⏰ ปรับความยาวสวิงตามกรอบเวลา: ค่าที่สูงขึ้นสำหรับกรอบเวลาที่สูงขึ้น
• 🛡️ ผสมผสานเสมอกับการจัดการความเสี่ยงที่เหมาะสม
สรุป
Key features include:
- Horizontal lines marking bullish (green) and bearish (red) structure breaks.
- A histogram on the right side of the chart divided into rows representing equal price ranges, showing accumulated volume of bullish and bearish breaks. Larger bars indicate higher volume.
- A grid marking the maximum and minimum price range of the analyzed period, divided into equal sections for easier reading.
The indicator recalculates automatically at the close of each candle, updating with any new structure breaks. Main adjustable parameters include the number of bars analyzed backward, swing length sensitivity for pivot detection, histogram rows, histogram width, and display mode (separated buy/sell or aggregated volume).
Volume Break Structure can be combined with trend analysis, support and resistance levels, order flow tools, and price action patterns to confirm market movements and identify potential entry points. It works with confirmed historical data and does not predict future price action.
รีวิวจากลูกค้า
5 | 0 % | |
4 | 100 % | |
3 | 0 % | |
2 | 0 % | |
1 | 0 % |


!["High-Low Divergence [Iridio Capital]" โลโก้](https://cdn.ctrader.com/image/webp/443c4661-7abb-40f1-842f-4b6ec560649b_40914)


