คำอธิบาย
HAI Quantum V10 เป็นตัวบ่งชี้ขั้นสูงที่ออกแบบมาสำหรับการวิเคราะห์ทางเทคนิคของสินทรัพย์ทางการเงิน โดยเฉพาะอย่างยิ่งมีประสิทธิภาพในตลาดที่ผันผวน สถาปัตยกรรมของมันผสมผสานความฉลาดของอัลกอริทึมกับรูปแบบพฤติกรรมราคา ช่วยให้นักเทรดสามารถระบุโซนที่มีความน่าจะเป็นสูงสำหรับการเข้าและออกได้
🔥 ข้อเสนอพิเศษกลับสู่ตลาด – จำกัดเวลาพิเศษ!
วันหยุดสิ้นสุดแล้ว และถึงเวลาที่จะกลับมาทำธุรกิจอีกครั้ง เมื่อ ตลาดเริ่มตื่นตัว กลยุทธ์ของคุณก็ควรเช่นกัน
เพื่อเฉลิมฉลองการกลับมาทำงาน ฉันขอนำเสนอเครื่องมือการเทรดที่ทรงพลังที่สุดของฉัน — HAI Quantum V10 — ในราคาเพียง $49.
นี่คือ ข้อเสนอจำกัดเวลา ที่ออกแบบมาสำหรับนักเทรดที่จริงจังที่ต้องการเริ่มต้นฤดูกาลอย่างแข็งแกร่ง ไม่ว่าคุณจะกำลังปรับแต่งความได้เปรียบของคุณหรือมองหาระบบที่เชื่อถือได้ นี่คือโอกาสของคุณที่จะได้ตัวบ่งชี้ที่พิสูจน์แล้วในราคาพิเศษ
✅ สร้างขึ้นสำหรับทองคำ (XAUUSD) ✅ ทดสอบในหลายกรอบเวลา ✅ ออกแบบโดยนักเทรด สำหรับนักเทรด
อย่ารอช้า — ข้อเสนอนี้จะไม่อยู่นาน กลับเข้าสู่เกมด้วยความมั่นใจและความแม่นยำ
ผลิตภัณฑ์ของเรารวมชุดตัวบ่งชี้หลักเพื่อให้คุณมีมุมมองตลาดที่ครอบคลุม:
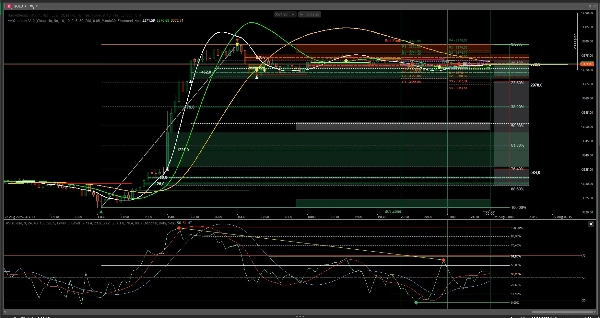
- Range Box Fibonacci (ผลงานของเราเอง): เครื่องมือที่ไม่เหมือนใครที่ช่วยให้คุณระบุโซนแนวรับและแนวต้านที่เป็นไปได้โดยอิงจากระดับ Fibonacci
- ราคากลางอ้างอิงสำคัญ: เรากำหนดจุดราคาสำคัญจากการรวมตัวของตัวบ่งชี้ที่ปรับแต่งได้สามตัว (CCI, Stochastic, RSI) จุดเหล่านี้จะช่วยชี้นำคุณในการระบุโอกาสเข้าและออก
- ค่าเฉลี่ยเคลื่อนที่สามแบบที่ปรับแต่งได้: เลือกค่าเฉลี่ยเคลื่อนที่ที่เหมาะสมกับกลยุทธ์ของคุณเพื่อยืนยันแนวโน้มและตรวจจับการเปลี่ยนแปลงทิศทางราคา
- RSI: สำหรับการทำนายการเคลื่อนไหวของราคาที่แม่นยำยิ่งขึ้น โดยมีค่าสูงและต่ำสำหรับช่วงเวลาที่เลือก ไม่รวมในการแสดงผล
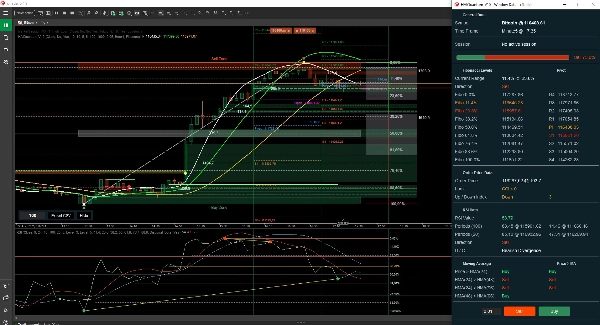
HAI Quantum รวบรวมและประมวลผลข้อมูลจากตัวบ่งชี้เหล่านี้ โดยเสนอวิธีการแสดงผลสองแบบ:
- โหมดแมนนวล: หน้าต่างที่ชัดเจนและกระชับสรุปว่าราคาตามการตั้งค่าตัวบ่งชี้แต่ละตัวกำลังเคลื่อนที่ขึ้นหรือลง
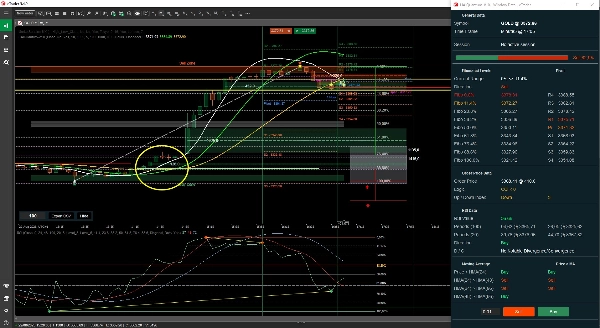
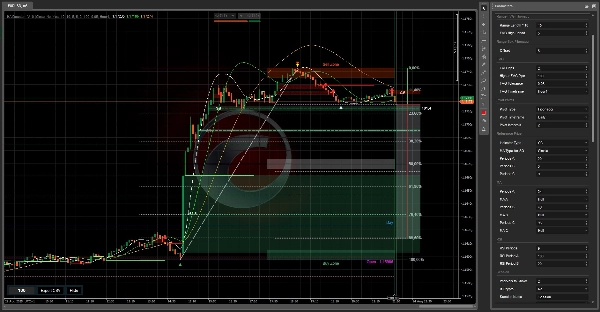
- หน้าต่างข้อมูลใหม่ที่เน้นระดับ Fibonacci และ Pivot: ในเวอร์ชันใหม่นี้ เราได้รวม FVG (Fair Value Gap) ซึ่งสามารถกรองตามขนาดและความใกล้เคียงกับระดับ Fibonacci หรือ Pivot พร้อมจุดบรรเทาของพวกมัน ดังที่แสดงในภาพ
สรุป
รีวิวจากลูกค้า
5 | 100 % | |
4 | 0 % | |
3 | 0 % | |
2 | 0 % | |
1 | 0 % |