คำอธิบาย
ตัวบ่งชี้การจัดกลุ่ม
ภาพรวม
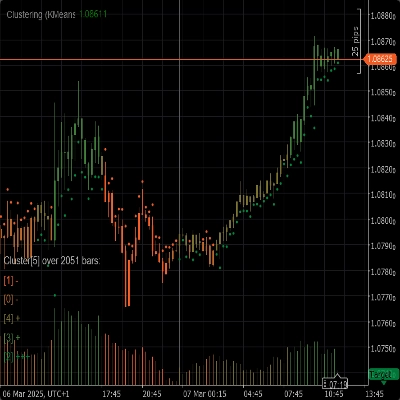
ตัวบ่งชี้การจัดกลุ่มเป็นเครื่องมือที่ทรงพลังที่ออกแบบมาเพื่อช่วยเทรดเดอร์ในการระบุรูปแบบ แนวโน้ม และความผิดปกติในข้อมูลตลาด โดยการจัดกลุ่มจุดข้อมูลที่คล้ายกันเข้าเป็นกลุ่ม ตัวบ่งชี้นี้ให้ข้อมูลเชิงลึกที่มีคุณค่าซึ่งสามารถใช้ในการตัดสินใจเทรดอย่างมีข้อมูล
คุณสมบัติ
- อัลกอริทึมการจัดกลุ่ม: ใช้อัลกอริทึมการจัดกลุ่มขั้นสูง เช่น K-Means และ Gaussian Mixture Model (GMM) เพื่อแบ่งข้อมูลตลาดอย่างมีประสิทธิภาพ
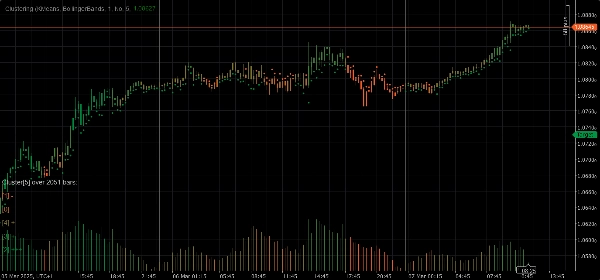
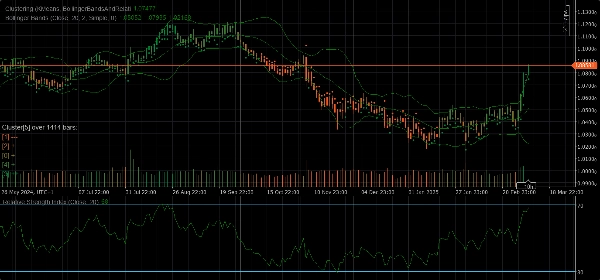
- ชุดคุณลักษณะ: มีชุดคุณลักษณะที่หลากหลายรวมถึงราคาดิบ, Bollinger Bands, ดัชนีความแข็งแกร่งสัมพัทธ์ (RSI), Stochastic Oscillator, Bollinger Bands และ RSI รวมถึงการรวมกันของตัวบ่งชี้เหล่านี้เพื่อจับแง่มุมต่าง ๆ ของพฤติกรรมตลาด
- การจัดกลุ่มแบบไดนามิก: กำหนดจำนวนกลุ่มที่เหมาะสมโดยอัตโนมัติเพื่อให้การจัดกลุ่มมีความแม่นยำสูงสุด
- การแสดงผล: ให้ข้อมูลเชิงลึกทางภาพที่ชัดเจนเกี่ยวกับการเคลื่อนไหวของกลุ่มและความผันผวนโดยตรงบนแผนภูมิของคุณ
พารามิเตอร์
- อัลกอริทึมการจัดกลุ่ม: เลือกระหว่าง K-Means หรือ Gaussian Mixture Model (GMM) เพื่อให้เหมาะสมกับกลยุทธ์การเทรดของคุณ
- ชุดคุณลักษณะ: เลือกจากราคาดิบ, Bollinger Bands, RSI, Stochastic Oscillator, Bollinger Bands และ RSI หรือชุดข้อมูลตลาดเต็มรูปแบบที่รวมตัวบ่งชี้ต่าง ๆ
- หน้าต่าง: กำหนดจำนวนแท่งที่พิจารณาสำหรับแต่ละจุดข้อมูล
- Auto K: กำหนดจำนวนกลุ่มโดยอัตโนมัติตามข้อมูลของคุณ
- Initial K: กำหนดจำนวนกลุ่มเริ่มต้นหากปิดใช้งาน Auto K
- จำนวนแท่งประวัติสูงสุด: จำกัดจำนวนแท่งประวัติสูงสุดที่ใช้สำหรับการจัดกลุ่ม หากตั้งค่าเป็น 0 จะใช้แท่งทั้งหมดที่มีอยู่
- สีตามกลุ่ม: เปิดหรือปิดการเปลี่ยนสีแผนภูมิตามการกำหนดกลุ่มจริง
- แสดงข้อมูลเชิงลึก: แสดงข้อมูลเชิงลึกโดยละเอียดเกี่ยวกับแต่ละกลุ่มโดยตรงบนแผนภูมิ
- แสดงตัวบ่งชี้: แสดงตัวบ่งชี้ที่ใช้ในชุดคุณลักษณะ
พารามิเตอร์การปรับตัวอัตโนมัติ
- การปรับตัวอัตโนมัติ: เปิดหรือปิดโหมดการปรับตัวอัตโนมัติ ซึ่งอนุญาตให้ตัวบ่งชี้เริ่มต้นกลุ่มใหม่ตามเงื่อนไขที่กำหนด
- ชั่วโมงการปรับตัวอัตโนมัติ: ชั่วโมงของวันเมื่อสามารถเกิดการปรับตัวอัตโนมัติได้ (0-23)
- ช่วงเวลาการปรับตัวอัตโนมัติ: จำนวนชั่วโมงขั้นต่ำที่ต้องผ่านไปตั้งแต่การปรับตัวครั้งล่าสุดก่อนที่จะเกิดการปรับตัวครั้งถัดไป
พารามิเตอร์ชุดคุณลักษณะ
พารามิเตอร์ Bollinger Bands
- ช่วงเวลา: ช่วงเวลาสำหรับการคำนวณ Bollinger Bands
- ส่วนเบี่ยงเบน: ตัวคูณส่วนเบี่ยงเบนมาตรฐานสำหรับ Bollinger Bands
- ประเภทค่าเฉลี่ยเคลื่อนที่: ประเภทของค่าเฉลี่ยเคลื่อนที่ที่ใช้ในการคำนวณ Bollinger Bands (เช่น แบบง่าย, แบบเลขชี้กำลัง ฯลฯ)
พารามิเตอร์ดัชนีความแข็งแกร่งสัมพัทธ์ (RSI)
- ช่วงเวลา: ช่วงเวลาสำหรับการคำนวณ RSI
พารามิเตอร์ Stochastic Oscillator
- ช่วงเวลา: ช่วงเวลา K สำหรับ Stochastic Oscillator
- การชะลอ K: ปัจจัยการชะลอ K สำหรับ Stochastic Oscillator
- ช่วงเวลา D: ช่วงเวลา D สำหรับ Stochastic Oscillator
- ประเภทค่าเฉลี่ยเคลื่อนที่: ประเภทของค่าเฉลี่ยเคลื่อนที่ที่ใช้ในการคำนวณ Stochastic Oscillator (เช่น แบบง่าย, แบบเลขชี้กำลัง ฯลฯ)
- ประเภทการคำนวณ: ประเภทการคำนวณสำหรับ Stochastic Oscillator (LowHigh, CloseClose ฯลฯ)
การใช้งาน
1. เพิ่มตัวบ่งชี้การจัดกลุ่มลงในแผนภูมิของคุณ
2. กำหนดค่าพารามิเตอร์ตามกลยุทธ์การเทรดของคุณ
3. วิเคราะห์กลุ่มและการเคลื่อนไหวของพวกเขาบนแผนภูมิ
4. ใช้ข้อมูลเชิงลึกที่ตัวบ่งชี้ให้มาเพื่อทำการตัดสินใจเทรดอย่างมีข้อมูล
สรุป
รีวิวจากลูกค้า
5 | 50 % | |
4 | 50 % | |
3 | 0 % | |
2 | 0 % | |
1 | 0 % |
!["[CB] Pivot Points Pro" โลโก้](https://cdn.ctrader.com/image/webp/43463c82-67b0-4f10-a4ba-901bba091d81_32594)

!["[Stellar Strategies] MARSI Signal Plotter" โลโก้](https://cdn.ctrader.com/image/webp/7b2b8da6-8f8e-4646-8d4a-4710c516c01e_25567)


