
ORB SMA
Indicator
184 downloads
Version 1.0, Feb 2026
Windows, Mac
4.0
Reviews: 1
Description
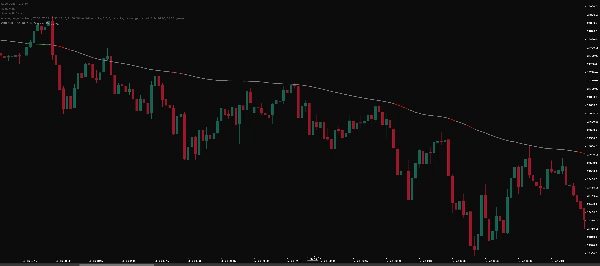
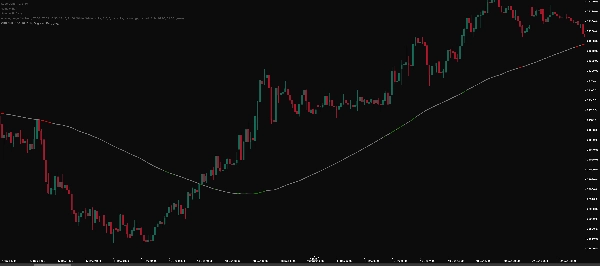
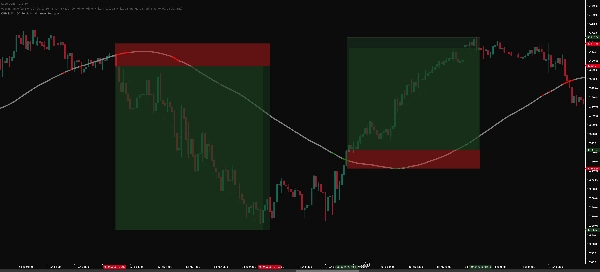
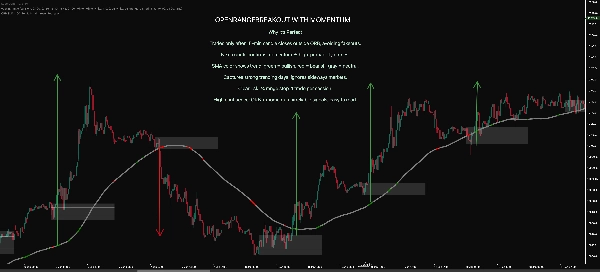
Breakout SMA by SLA is a trend-filtering tool designed to enhance the ORB SLA framework.
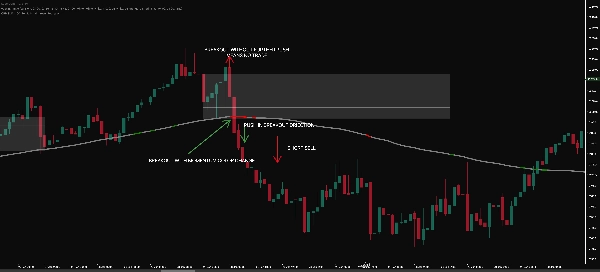
It works by combining price action with a directional SMA/SMMA, Bollinger Band breakouts, and RSI momentum. The line color dynamically changes to indicate the likely breakout direction:
- 🟢 bullish
- 🔴 bearish
- ⚪ neutral
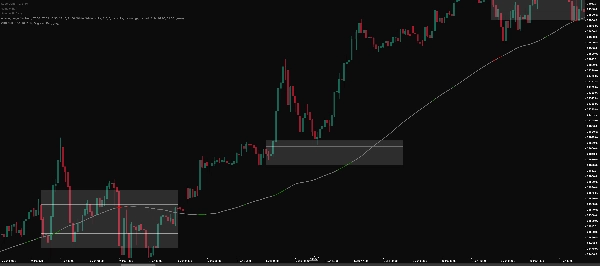
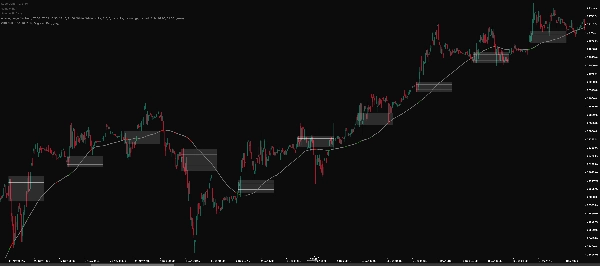
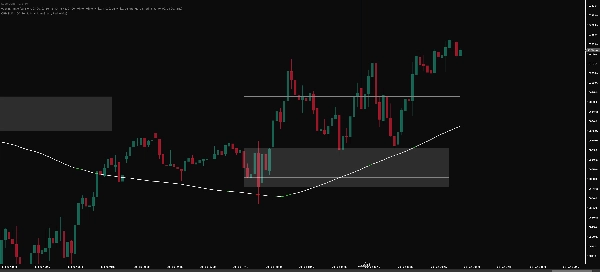
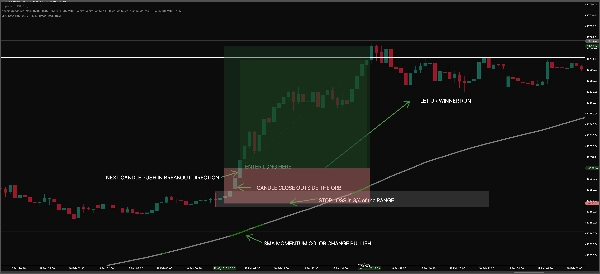
Breakouts are confirmed only when price aligns with the SMA trend, helping to filter false moves. The SMA can also be used to trail your stop-loss, letting you manage trades along the evolving trend.
Ideal for disciplined intraday traders seeking structured ORB confirmations, momentum validation, and clear visual cues.
Summary
AI summary
ORB SMA is a trend-filtering indicator designed to enhance the ORB SLA trading framework. It integrates price action with a directional Simple Moving Average (SMA) or Smoothed Moving Average (SMMA), Bollinger Band breakouts, and Relative Strength Index (RSI) momentum to identify potential breakout directions. The indicator dynamically changes line color to signal bullish (green), bearish (red), or neutral (white) breakout conditions. Breakouts are confirmed only when the price movement aligns with the SMA trend, which helps filter out false signals. Additionally, the SMA can be used to trail stop-loss orders, aiding trade management along evolving trends. This tool is suitable for intraday traders seeking structured breakout confirmations, momentum validation, and clear visual cues across various markets including Forex, indices, commodities, stocks, and cryptocurrencies. It supports symbols such as BTCUSD, EURUSD, GBPUSD, NZDUSD, XAUUSD, USDJPY, and indices like NAS100 and FTSE100. The indicator incorporates multiple technical elements including RSI, Bollinger Bands, ATR, MACD, Supertrend, and VWAP to provide comprehensive trend and momentum analysis.
Indicator profile
Customer reviews
4.0
Reviews: 1
5 | 0 % | |
4 | 100 % | |
3 | 0 % | |
2 | 0 % | |
1 | 0 % |
Customer reviews
March 5, 2026
ORB SMA is a helpful trend filter designed to support ORB-style breakout trading. It combines SMA direction, Bollinger Band breakout logic and RSI momentum to confirm potential moves. The dynamic color change (bullish, bearish, neutral) makes market direction easy to read. A practical tool for traders looking to filter false breakouts and trade with trend confirmation.
Discussion
FAQ
BTCUSD
Forex
Breakout
Indices
EURUSD
Commodities
GBPUSD
NZDUSD
RSI
Bollinger
Prop
Supertrend
Crypto
Stocks
XAUUSD
NAS100
ATR
MACD
USDJPY
VWAP
Products available through cTrader Store, including trading bots, indicators and plugins, are provided by third-party developers and made available for informational and technical access purposes only. cTrader Store is not a broker and does not provide investment advice, personal recommendations or any guarantee of future performance.
More from this author


Price
Since 23/02/2025
1
Sales
184
Free installs