
STC
Indicator
278 downloads
Version 1.0, Jan 2025
Windows, Mac
5.0
Reviews: 2
Description
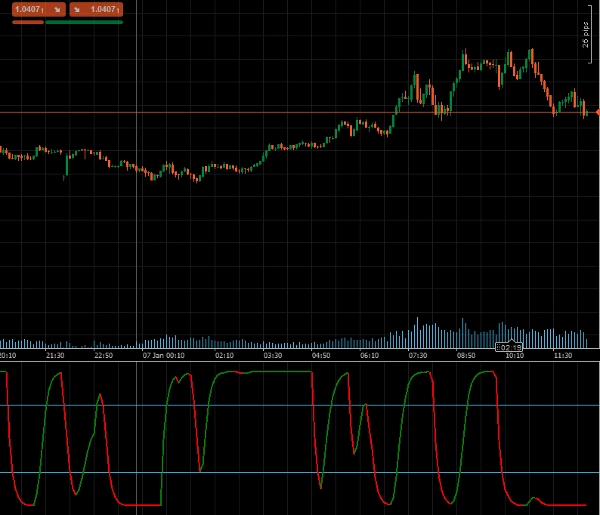
The Schaff Trend Cycle (STC), developed by renowned technical analyst Doug Schaff, is an advanced trading indicator designed to identify market trends and reversals with exceptional speed and precision. Rooted in the innovative idea of combining trend and cycle components, the STC leverages exponential moving averages (EMAs) and stochastic calculations to overcome the limitations of lagging indicators like MACD or Stochastic Oscillator. This unique approach provides earlier, more reliable trading signals, offering a significant edge in trend detection and market analysis.
Key Features:
- Early Trend Detection: Combines exponential moving averages (EMAs) with stochastic calculations to capture trends faster.
- Customizable Settings: Adjust length, fast MA, slow MA, MA type and smoothing factor to suit your trading strategy.
- Visual Alerts: Dynamic color changes indicate bullish or bearish trends, making it easy to interpret market conditions.
- Support for Overbought/Oversold Levels: Built-in levels (25 and 75) help identify potential market turning points.
Parameters
- Length: Defines the number of periods for trend calculation.
- Fast MA Length: Sets the length of the fast-moving average.
- Slow MA Length: Specifies the length of the slow-moving average.
- MA Type: Allows selection of the moving average type (e.g., EMA, SMA).
- Smooth Factor: Adjusts the smoothing factor for refined trend signals.
Outputs
- STC: Outputs the primary Schaff Trend Cycle value, representing trend direction and strength, for programmatic use in automated trading systems.
- STCBull: Highlights bullish trend conditions.
- STCBear: Highlights bearish trend conditions.
Summary
Indicator profile
Customer reviews
5.0
Reviews: 2
5 | 100 % | |
4 | 0 % | |
3 | 0 % | |
2 | 0 % | |
1 | 0 % |
Customer reviews
August 12, 2025
Pros: Fast and accurate trend detection, earlier signals than MACD, customizable levels. Cons: No alerts, no MTF mode, no trade statistics.
Discussion
FAQ
MACD
Products available through cTrader Store, including trading bots, indicators and plugins, are provided by third-party developers and made available for informational and technical access purposes only. cTrader Store is not a broker and does not provide investment advice, personal recommendations or any guarantee of future performance.
More from this author


!["[Hamster-Coder] Pivot Points MTF" logo](https://cdn.ctrader.com/image/webp/4c143e5a-309c-40e3-a578-f04d1e133ffa_31159)


Price
Since 24/09/2024
4.45K
Free installs