
Description
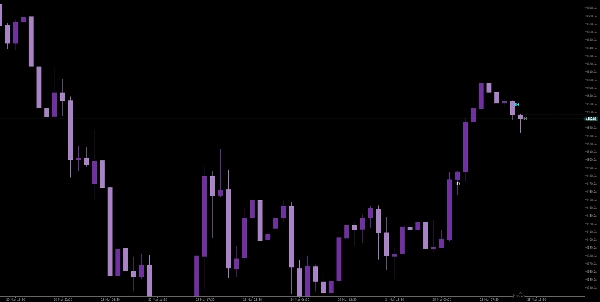
Opening Price Rays — cTrader Indicator
Plots horizontal rays from the opening price of up to 3 customizable timeframes directly on your chart. Helps you instantly see where each timeframe's candle opened, acting as key reference levels for bias, entries, and reactions.
Key Points:
- 3 Independent Timeframes — Each with its own color, line style, thickness, and label toggle. Fully customizable to avoid visual clutter.
- Current or Previous Candle — Each timeframe lets you choose whether to plot the open of the current candle or the previous one. Useful for confirmed levels.
- Ray Extends to Infinity — Lines aren't just short marks — they extend across the entire chart so you never lose the level regardless of zoom.
- Auto-Labeled — Each ray displays a short timeframe tag (e.g., 1H, 4H, 1D) right at the start of the line for quick identification.
- Overlay Indicator — Draws directly on the price chart, no separate panel needed.
- Smart Label Formatting — Internally converts cTrader's timeframe names into clean, readable labels like 1M, 3H, 1D, 1W, 1MO.
- Efficient Rendering — Only recalculates on the latest bar, so it doesn't reprocess historical data unnecessarily.
Summary
AI summary
WeOpen is a cTrader indicator that plots horizontal rays from the opening prices of up to three customizable timeframes directly on the price chart. Each timeframe’s opening price is represented by a distinct ray with configurable color, line style, thickness, and optional labeling to minimize visual clutter. Users can select whether to display the opening price of the current or previous candle for each timeframe, allowing for confirmed level analysis. The rays extend infinitely across the chart, ensuring key reference levels remain visible regardless of zoom. Each ray is auto-labeled with a concise timeframe tag (e.g., 1H, 4H, 1D) for quick identification, with smart formatting that converts cTrader’s timeframe names into clear labels such as 1M, 3H, 1W, or 1MO. The indicator overlays directly on the price chart without requiring a separate panel and optimizes performance by recalculating only on the latest bar. It supports various markets including Forex, commodities, indices, stocks, and cryptocurrencies, making it useful for traders seeking to identify bias, entry points, and price reactions based on opening price levels across multiple timeframes.
Indicator profile
Customer reviews
0.0
Reviews: 0
Customer reviews
No reviews for this product yet. Already tried it? Be the first to tell others!
Discussion
FAQ
BTCUSD
Forex
Signal
Breakout
Indices
EURUSD
Commodities
GBPUSD
NZDUSD
Martingale
Prop
Scalping
SMC
Crypto
Grid
Stocks
AI
XAUUSD
NAS100
USDJPY
Products available through cTrader Store, including trading bots, indicators and plugins, are provided by third-party developers and made available for informational and technical access purposes only. cTrader Store is not a broker and does not provide investment advice, personal recommendations or any guarantee of future performance.
More from this author


Price
2.83K
Free installs