Açıklama
Ana Tepeler ve Dipler Göstergesi: Kapsamlı Bir Genel Bakış
Giriş
Hızlı tempolu ticaret dünyasında, elinizde doğru araçların olması tüm farkı yaratabilir. Ana Tepeler ve Dipler göstergesi, piyasadaki kritik dönüş noktalarını belirlemek için tasarlanmıştır ve bu sayede yatırımcıların bilinçli kararlar almasını sağlar. Bu güçlü araç, önemli yüksek ve düşük seviyeleri tespit etmek için gelişmiş algoritmalar kullanır, ticaret stratejinizi geliştirir ve genel performansınızı artırır. 45 dakikalık zaman diliminde yaklaşık %60 ila %70 arasında ortalama doğruluk oranıyla, piyasa hareketlerinden faydalanmak isteyen yatırımcılar için güvenilir bir varlıktır ve hem günlük yatırımcılar hem de scalperlar için idealdir.
Temel Özellikler
1. Görsel Temsil
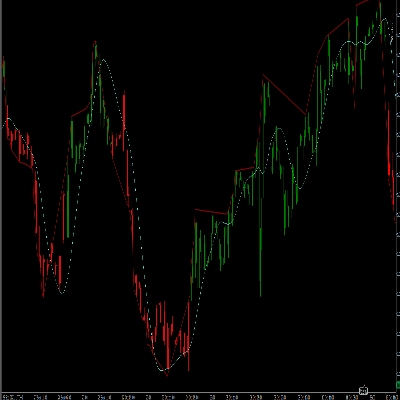
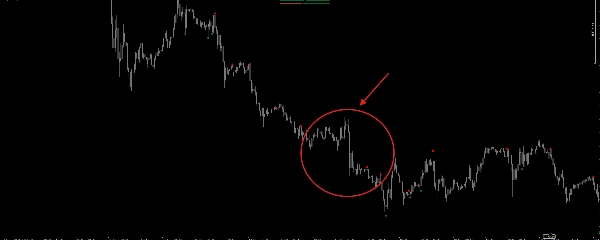
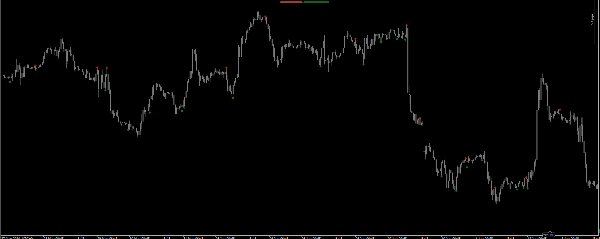
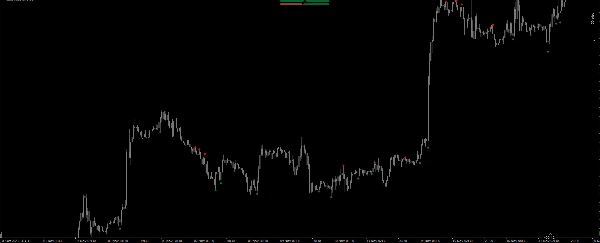
Ana Tepeler ve Dipler göstergesi, piyasa dinamiklerinin net bir görsel temsilini sunar. Ana tepeler kırmızı, ana dipler ise yeşil ile işaretlenmiştir; böylece yatırımcılar potansiyel dönüş noktalarını hızlıca tanımlayabilir. Noktaların kullanılması, bu kritik seviyelerin grafikte öne çıkmasını sağlar ve ticaret fırsatlarını anında fark etmeyi kolaylaştırır.
2. Doğru Hesaplamalar
Ana Tepeler ve Dipler göstergesinin özü, hesaplama yöntemindedir. Son dört barın fiyat hareketlerini analiz ederek, göstergesi önemli bir tepe veya dip oluşup oluşmadığını belirler. Bu, yüksek ve düşük fiyatların bir dizi karşılaştırması yoluyla gerçekleştirilir ve yalnızca önemli dönüş noktalarının tespit edilmesini sağlar.
3. Gelişmiş Scalping Teknikleri
Scalping konusunda uzmanlaşmış yatırımcılar için Ana Tepeler ve Dipler göstergesi paha biçilmez bir varlıktır. Ana dönüş noktalarını belirleyerek, yatırımcılar pozisyonlara hassasiyetle girip çıkabilirler. Ana tepeleri ve dipleri hızlıca tespit etme yeteneği, sıkı kar alma (TP) ve zarar durdurma (SL) yerleştirmelerine olanak tanır; böylece riski minimize ederken potansiyel kazançları maksimize eder. 45 dakikalık zaman dilimlerinde yaklaşık %60 ila %70 doğruluk oranına sahip olduğundan, sinyal kaçırıldığında potansiyel kayıpları azaltmak için zarar durdurma kullanılması şiddetle tavsiye edilir.
Ana Tepeler ve Dipler Göstergesinin Kullanımının Faydaları
1. Gelişmiş Karar Verme
Ana Tepeler ve Dipler göstergesi, yatırımcıların doğru piyasa analizine dayanarak bilinçli kararlar almasını sağlar. Önemli yüksek ve düşük seviyeleri belirleyerek, yatırımcılar fiyat hareketlerini daha iyi öngörebilir ve stratejilerini buna göre ayarlayabilirler. Bu gelişmiş karar verme süreci, genel ticaret performansını artırır.
2. Artan Kar Potansiyeli
Kritik dönüş noktalarını tespit etme yeteneği sayesinde, yatırımcılar piyasa dönüşlerinden daha etkili şekilde faydalanabilir. Ana Tepeler ve Dipler göstergesi, yatırımcıların pozisyonlara en uygun zamanda girmesini sağlar ve kar potansiyelini artırır. Sıkı TP ve SL seviyeleri kullanarak, yatırımcılar kazançlarını maksimize ederken risklerini minimize edebilirler.
3. Kullanıcı Dostu Arayüz
Ana Tepeler ve Dipler göstergesi, kullanıcı deneyimi göz önünde bulundurularak tasarlanmıştır. Ana tepeler ve diplerin net görsel temsili, yatırımcıların göstergenin sağladığı sinyalleri kolayca yorumlamasını sağlar. Bu kullanıcı dostu arayüz, her deneyim seviyesindeki yatırımcılar için erişilebilir kılar.
4. Çok Yönlü Uygulama
Günlük yatırımcı, swing trader veya scalper olmanız fark etmeksizin, Ana Tepeler ve Dipler göstergesi çeşitli ticaret stratejilerinde uygulanabilir. Çok yönlülüğü, farklı piyasa koşullarına uyum sağlama konusunda yatırımcıların araç setine değerli bir katkı sağlar.
Sonuç
Sonuç olarak, Ana Tepeler ve Dipler göstergesi, kritik piyasa dönüş noktalarını belirleyerek ticaret stratejilerini güçlendiren güçlü bir araçtır. Doğru hesaplamaları, görsel temsili ve cTrader platformuyla uyumluluğu sayesinde, yatırımcıların bilinçli kararlar almasını ve piyasa hareketlerinden faydalanmasını sağlar. Yaklaşık %70 doğruluk oranıyla, sinyal kaçırıldığında kayıpları minimize etmek için zarar durdurma uygulamak çok önemlidir. En iyi sonuçlar için bu göstergenin 45 dakikalık zaman diliminde kullanılması önerilir. İster deneyimli bir yatırımcı olun ister yeni başlıyor olun, Ana Tepeler ve Dipler göstergesi ticaret performansınızı önemli ölçüde artırabilir. Bu yenilikçi aracı stratejinize dahil ederek ticaret deneyiminizi bugün yükseltin.
Özet
Müşteri değerlendirmeleri
5 | 50 % | |
4 | 50 % | |
3 | 0 % | |
2 | 0 % | |
1 | 0 % |