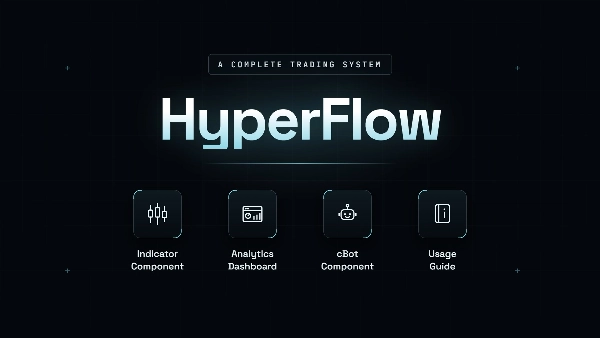

Description
> How the result is formed in HyperFlow: the model, the math, and the measurements
The first question most people ask about a trading system is simple: How much does it make?
Unfortunately, it's also the least informative question.
A return figure says nothing about how it was produced, how repeatable it is, or what it costs to sit through the drawdowns that produced it. To understand those things, you have to look at the mechanism behind the result.
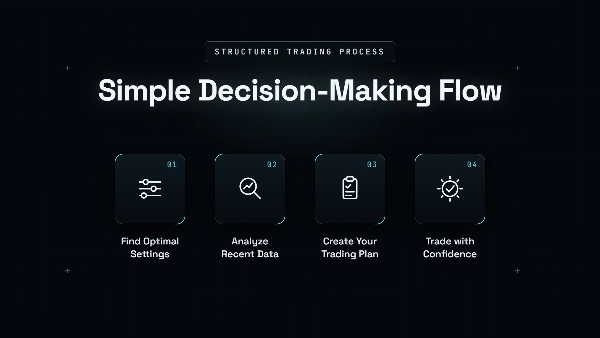
This article explains that mechanism for HyperFlow. It starts with the arithmetic that every trading system depends on, then shows how HyperFlow generates its edge, how that edge is refined through session selection and pullback entries, and finally how the entire process is verified on your own broker's data.
A sample backtest export accompanies this article so every concept can be checked against real measured output rather than theory.
> THE ARITHMETIC EVERY TRADING SYSTEM DEPENDS ON
Every trading strategy ultimately comes down to two variables:
- Average win versus average loss
- Win rate
Neither matters in isolation. A high win rate is meaningless if the losses are much larger than the wins, and a low win rate can still produce strong returns if the winners are significantly larger than the losers.
The result is always the combination of both.
💣 EXAMPLE 1: winning often, losing money
Take 12 trades where 9 finish in profit — a 75% win rate.
Now add the sizes: the average winner takes +6 pips, but the three losers average −24 pips each.
9 × 6 − 3 × 24 = −18 pips
Three out of four trades were winners, yet the account still lost money. This is the classic profile of a strategy that looks impressive on paper while slowly declining in practice.
💣 EXAMPLE 2: losing often, making money
Now invert it. Twelve trades, only 4 winners — a 33% win rate that would scare most people off.
But this time the losers are cut early at −8 pips on average, while the four winners ride trends for +30 pips each:
4 × 30 − 8 × 8 = +56 pips
Two-thirds of the trades lost, but the overall result is strongly positive. The profit comes from a small number of extended moves outweighing a series of controlled losses.
This second distribution is the one HyperFlow is designed around. The important difference is that HyperFlow does not assume the asymmetry exists—it measures it directly from your own data.
> WHERE HYPERFLOW'S ASYMMETRY COMES FROM
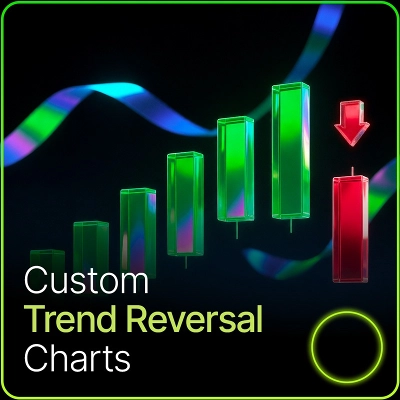
HyperFlow is a trend-following model. A sequence remains open while Trend-Reversal bars continue confirming the same direction, and it closes only when the trend genuinely changes.
That structure naturally creates an asymmetric distribution:
- Failed moves tend to end quickly, so losses remain relatively small.
- Strong trends can continue for many bars, so winners have no fixed ceiling.
The win rate is also reported conservatively. A sequence is counted as a win only if it exceeds a minimum pip threshold, which prevents scratches and near-break-even outcomes from artificially inflating the statistics.
The dashboard then shows the distribution from several angles:
- Mean and median displayed separately
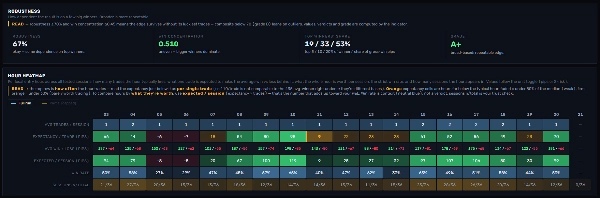
- A robustness grade that tests whether the edge survives after removing the best trades
- An hour-by-hour expectancy profile showing what a typical trade is worth during each session
The last metric becomes especially important, because it is the main lever used to improve the practical result without changing the underlying strategy.
> THE SECOND LAYER: TRADE THE HOURS THAT PAY
The core trend model stays the same. What changes the outcome is when it is allowed to trade.
The same parameter set can show strong positive expectancy during one part of the day and negative expectancy during another. Most traders never discover this because their tools do not measure it. HyperFlow's hourly breakdown and the dashboard's hour heatmap expose it directly: per-trade expectancy, per-session value, and sample size for every entry hour.
Restricting activity to the hours with demonstrated expectancy does three things at once:
- removes the entries most likely to be noise
- concentrates exposure where extended runs have historically occurred
- improves the distribution without touching a single parameter of the logic
This is deliberately the opposite of re-optimizing: the foundation stays put, and the refinement comes from scheduling, backed by measurement.
> THE THIRD LAYER: PULLBACK SIGNALS AND ENTRY STYLE
So far, the model has a single entry event: the trend switch. The Trend-Reversal bars create a second signal worth understanding: the pullback run.
A pullback run occurs when at least two consecutive TRev bars close against the prevailing trend. The trend itself has not changed—the HyperTrend engine still considers the regime intact—but price is retracing within that trend.
When a pullback run forms inside the pullback zone near the trend levels, it becomes a potential continuation entry: the same trend, but at a better price.
This creates three distinct execution styles:
1. Entry Refinement
Continue trading the trend as before, but use pullback runs to time the entry.
- Better average entry price
- Lower effective risk
- Similar trade frequency
The trade-off is that some strong trends never pull back, so a few of the best moves may be missed.
2. Scalping Orientation
Treat each qualifying pullback as its own short-term trade.
- Higher trade frequency
- More opportunities per session
- Smaller individual exposure
The downside is higher spread and commission costs, along with a greater demand for execution discipline.
3. Scaling Into Trends
Add to a position as new pullback runs appear while the trend remains intact.
- The strongest trends are captured with the largest position size
- The distribution becomes more positively skewed
The risk is that the position is largest late in the trend, so a reversal can give back a larger portion of open profit.
None of these approaches is universally better. Each changes the balance between frequency, cost, drawdown behavior, and average trade quality. The correct answer is the same throughout HyperFlow: test it and measure it.
> VERIFYING IT ON YOUR OWN DATA
Nothing in this workflow requires trust.
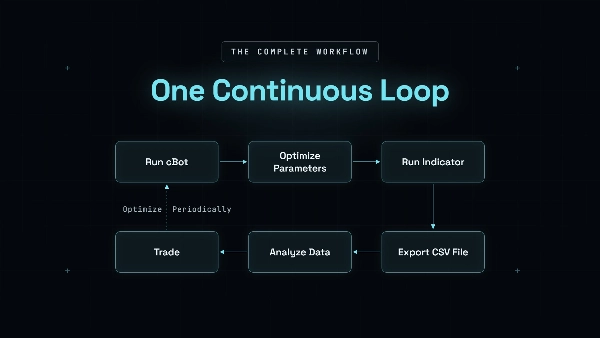
Step 1 — Optimize the cBot
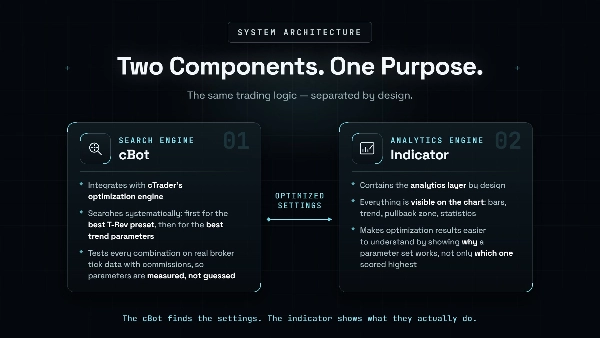
Run the optimizer in cTrader using your broker's tick data with commissions applied. Keep only parameter sets that remain profitable after realistic costs.
Step 2 — Load the Parameters into the Indicator
The indicator measures every sequence close-to-close using non-retroactive anchoring. Winners and losers are recorded exactly as they occurred.
Step 3 — Export to the Analytics Dashboard
The dashboard then shows:
- the equity curve
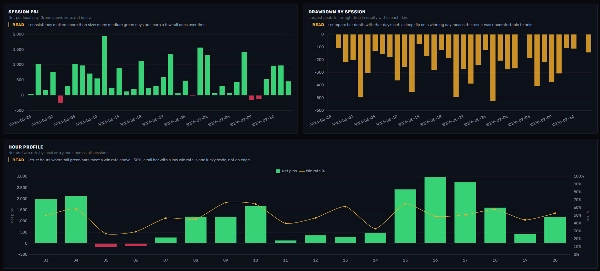
- session P&L
- drawdown by day
- the hour heatmap
- the robustness grade
One important note: the indicator's sequence statistics are market-structure measurements, not simulated trades. Spread and slippage are not included there. Realistic trading costs are handled during the cBot optimization pass, which is why the workflow uses both components together.
> THE HARD PART: LIVING THROUGH THE DISTRIBUTION
The real challenge of a trend-following system is not the mathematics. It is the experience of trading it.
Because a minority of extended runs generates most of the profit, the periods between those runs are filled with short sequences, small losses, and flat equity. The strategy is functioning normally, but it often feels as if nothing is working.
That is usually the moment when traders start skipping signals, changing settings mid-week, or abandoning the system just before the next major trend appears.
HyperFlow addresses this by making the difficult part visible in advance.
- Drawdown by session shows what a normal losing day looks like.
- Profit concentration metrics show how long the quiet periods between meaningful runs typically last.
> HOW THIS FITS PROP FIRM CHALLENGES
Prop firm evaluations reward one characteristic above all others: predictability.
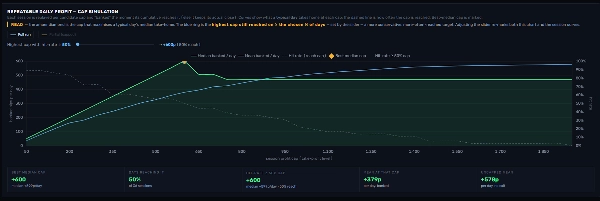
The dashboard's cap simulation replays every tested session against a range of daily profit caps and reports:
- the cap a typical day actually reached
- how often each cap was achieved
This is not a forecast. It is a historical replay that helps set a realistic daily target based on tested performance rather than optimism.
That aligns closely with how prop challenges are usually passed: not through a few exceptional trades, but through a series of controlled, repeatable days that stay within the firm's risk limits.
> ON TIMING
Trend systems are paid by specific moves, not by hours spent in the market. Some weeks deliver a major trend immediately; others require patience. A trend system is like sailing. The wind isn't yours to command — but when it comes, distance is covered fast. Rowing furiously on a calm day just drains the crew before the weather turns. Trading behaves the same way. Forcing entries when the market is not moving simply adds trades, risk, and transaction costs without improving the result.
HyperFlow does have one advantage - you're not limited to one boat. Trend-Reversal bars automatically adapt to each market's volatility, increasing the odds that favorable conditions exist somewhere. The rule remains the same, though: trade only when those conditions are present.
> SUMMARY
HyperFlow's result comes from four measurable layers:
- Asymmetry: small controlled losses versus open-ended trend runs
- Session selection: trading only the hours with demonstrated expectancy
- Entry style: refining or scaling positions around pullback runs
- Verification: testing the entire process on your own broker's data before risking capital
The return is the output of that process.
What the trader controls is the input: executing the measured structure consistently through both the quiet periods and the trend runs that ultimately pay for them.
HyperFlow's job is to measure the edge honestly. The trader's job is to execute it consistently.
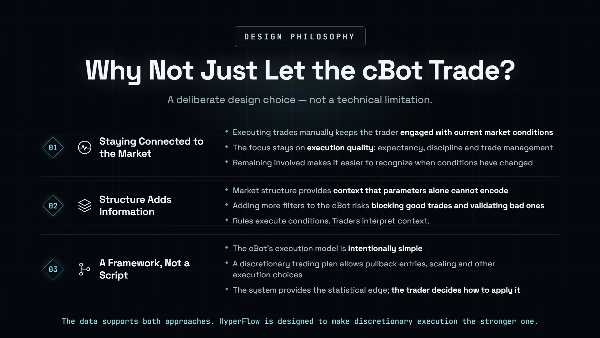
> How to get the system and related materials
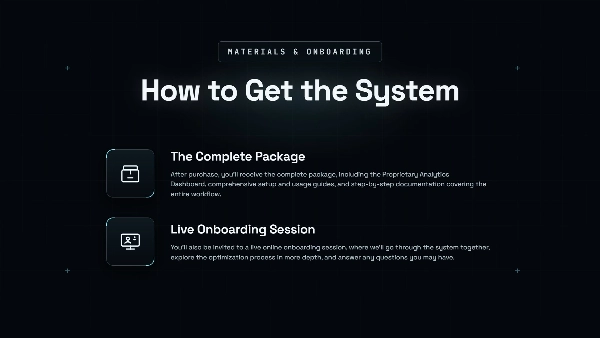
After purchase, you'll receive the complete package, including the Proprietary Analytics Dashboard, comprehensive setup and usage guides, and step-by-step documentation covering the entire workflow.
You'll also be invited to a live online onboarding session, where we'll go through the system together, explore the optimization process in more depth, and answer any questions you may have.
Summary
Key features include:
- Optimization using real broker tick data and realistic trading costs (commissions), conducted via cTrader’s native optimization environment.
- Identification of historically strong parameter settings by testing various HyperFlow configurations.
- Seamless transfer of optimized parameters to the HyperFlow Indicator without adjustment, enabling a unified Optimize → Validate → Analyze → Refine workflow.
- Support for detailed analysis of trading sequences, session performance, drawdown behavior, hourly profitability, and strategy consistency.
- Flexibility to use optimized settings manually with the indicator and dashboard or deploy the cBot for automated execution.
- Risk management tools including fixed lot sizing, take profit, stop loss, trailing stop loss, and session filters.
- Designed for trend-following day trading with medium trade frequency and supports order types such as limit, stop limit, and stop orders.
- Backtested with leverage up to 1:500 and suitable for prop trading firms.
The package includes the cBot, indicator, analytics dashboard, setup documentation, and onboarding support. It targets traders seeking a data-driven, realistic optimization workflow for trend-based strategies.