Description
Stop exporting trades to spreadsheets. PnL Calendar Pro adds a clean dashboard tab to cTrader's Trade Watch that turns your closed-trade history into something you can actually read at a glance — and it updates the moment a position closes.
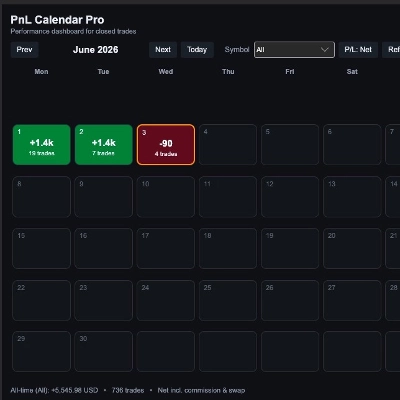
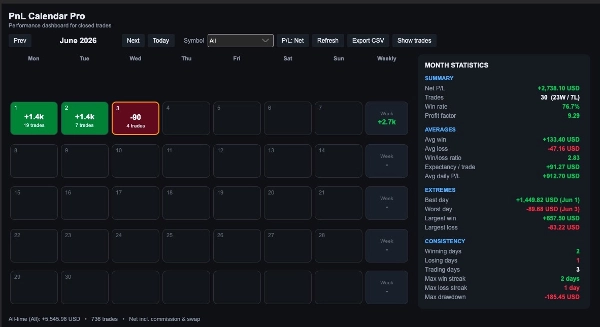
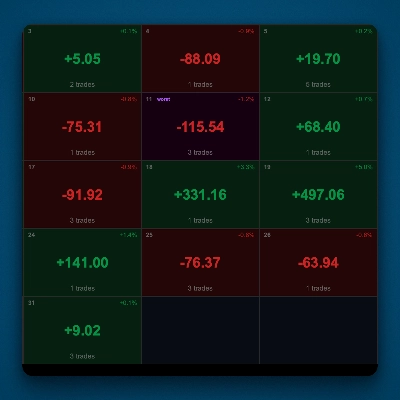
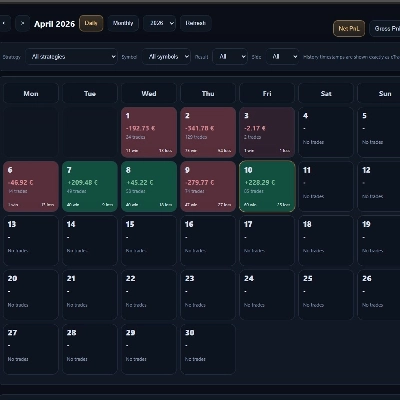
A color-coded monthly calendar shows your winning and losing days, shaded by how big each day was, next to a complete breakdown of the numbers that tell you whether you're really improving.
At-a-glance calendar
- Color-coded monthly grid — green winning days, red losing days
- Heatmap intensity scaled to the size of each day's P/L, so your biggest days stand out instantly
- Daily trade count on every day
- Weekly totals column
- Today highlighted; move through months with Prev / Next / Today
Complete performance dashboard
- Net P/L, total trades, wins vs. losses
- Win rate and profit factor
- Average win, average loss, and win/loss (payoff) ratio
- Expectancy per trade and average daily P/L
- Best and worst day, plus largest single winning and losing trade
- Winning / losing / trading day counts
- Longest winning-day and losing-day streaks
- Maximum closed-trade drawdown for the month
Built for how you actually trade
- Filter by symbol to analyze one instrument or your entire book
- Toggle between Net (including commission & swap) and Gross P/L
- Expandable trade list for the selected month
- One-click CSV export for deeper analysis
- Live refresh — the dashboard updates automatically when a position closes
Private, lightweight, and native
- Reads only your local closed-trade history — nothing is uploaded or sent anywhere
- Requires no special access permissions
- Sleek dark theme that blends into the platform
- Works with cTrader on both Windows and macOS
Who it's for
Discretionary and systematic traders who want instant, honest feedback on their results — without leaving the platform or babysitting a spreadsheet.
Getting started
Install the plugin, open a Trade Watch panel, and select the PnL Calendar Pro tab. Your month starts filling in immediately from your trade history.
Summary
Key features include a color-coded monthly calendar where winning days are shown in green and losing days in red, with heatmap intensity reflecting the size of each day’s profit or loss. The calendar displays daily trade counts, weekly totals, and highlights the current day, allowing easy navigation through months.
The performance dashboard provides comprehensive metrics such as net and gross P/L, total trades, win/loss counts, win rate, profit factor, average win/loss, payoff ratio, expectancy per trade, best/worst days, largest single trades, streaks, and maximum drawdown for the month.
Users can filter data by trading symbol, toggle between net and gross P/L, expand monthly trade lists, and export data to CSV for further analysis. The plugin operates locally without uploading data, requires no special permissions, and supports both Windows and macOS with a dark theme that integrates seamlessly into the platform.
Designed for discretionary and systematic traders, PnL Calendar Pro offers immediate, clear feedback on trading performance without leaving cTrader or managing external spreadsheets.





!["Custom Timeframes [Iridio Capital]" logo](https://cdn.ctrader.com/image/webp/4d75a920-23c7-4fea-a7b5-594a9d067f2e_63286)