"AlgoCorner Crosshair Edge" logo
AlgoCorner Crosshair Edge
"AlgoCorner Crosshair Edge" uploaded image
8
Sales
285
Free installs

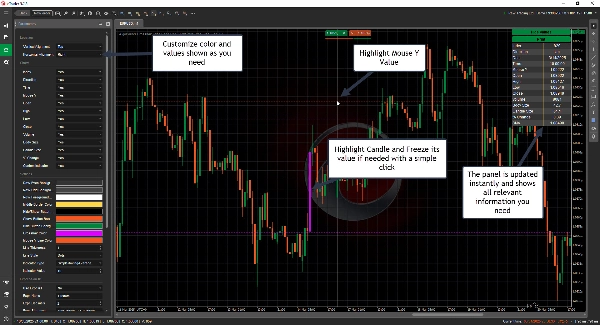
Crosshair Edge: The best cTrader Data Visualization Tool

With Crosshair Edge, a robust tool that improves the visualization of market data inside the cTrader platform, you can elevate your chart analysis to new heights.

Enhanced Chart Interaction

  • Highlight the current bar and its range
  • Freeze the crosshair on a specific candle with a click, and unlock again with a click when needed
  • Send values to your log so it can be easily copied
  • Show or hide the layout as needed


Full Customization

  • Personalize the colors to your style
  • Adjust the crosshair to any location you need inside the chart
  • Select which values are on display and which values should be omitted

Instant Candle Data Display

Simply hover on any candle to check all its details and more

  • Index
  • Direction
  • Date
  • Time
  • Mouse Y Price
  • Open
  • High
  • Low
  • Close
  • Volume
  • Body Size
  • Candle Size
  • % Change
  • Multiple indicator values
    • ADX
    • ATR
    • Chaikin Money Flow
    • EMA, HMA, SMA, TSMA, TMA, WMA
    • On Balance Volume
    • RSI
    • STD
    • Weighted Close
    • Welles Wilder Smoothing
    • Williams %R
  • Draw Horizontal/Vertical Lines with easy hotkeys
    • Draw Horizontal Line: Ctrl + 1
    • Draw Vertical Line: Ctrl + 2
    • Hotkeys fully customizable
  • Customizable Formulas
    • Use Open, High, Low, Close, and Index to compute formulas that suite your needs
    • Example, Typical Price: (High[index] + Low[index] + Close[index])/3.0

Seamless Integration

  • License linked to your cTrader ID for ease of use
  • Future updates included

Upgrade your trading experience with Crosshair Edge today! 🚀

Indicator profile
0.0
Reviews: 0
Customer reviews
No reviews for this product yet. Already tried it? Be the first to tell others!
RSI
Indices
ATR
Products available through cTrader Store, including trading bots, indicators and plugins, are provided by third-party developers and made available for informational and technical access purposes only. cTrader Store is not a broker and does not provide investment advice, personal recommendations or any guarantee of future performance.

More from this author

Draw as many Moving Averages as you need from a simple indicator.
This tool will help you spread your trades very quickly with a few clicks
Visualize market asymmetry like never before — steady climbs meet sudden drops with the Donchian PSAR
Supertrend Scanner – Track trends across assets & timeframes in real-time with alerts. Stay ahead, and trade smarter!
Designed to follow price more naturally, adjusting automatically to market speed, to reduce lag and false signals.
Check the correlations between dozens of assets in one elegant display.
A long-term indicator created by E.S.C. Coppock
Place professional OCO & OSO orders in cTrader — visually, instantly, and without execution mistakes.
Custom trading dashboard for fast one-click orders. Set Stop Loss, Take Profit, and customize layout & symbols easily.
Show each Market Session with full details, including grid mode for higher timeframes, statistics, and other metrics.
Track the Movement of Market Assets with an Oscillator Scanner in Real-Time!

You may also like

Professional trend analysis using Moving Median for precise market direction signals.
Indicatore dei livelli numeri tondi sul grafico , regolabile.Indicator of levels round numbers on the graph, adjustable
Want a cBot based on this indicator? Contact us!
Auto-detects Bullish/Bearish Engulfing patterns to spot trend reversals. Real-time alerts, custom colors, all symbols.
Customize your Moving Average! Choose any timeframe and price source for precision and flexibility in your analysis.
INDICATOR,LIQUIDITY POOLS,ACCURATE SIGNAL, NO DELAY,80% PROBABILITY
Block Liquidity,indicator.Block Order, Liquids Stops, Signal Sentiment,signal correction
Master market structure with auto ZigZag, Pattern detection & MTF alerts.
Advanced Volatility Suite - Institutional-Grade Volatility Forecasting
Volume Weighted Average Price (VWAP)
🌊 See when the market is truly in play. Tsunami measures Relative Volume by time-of-day 🌊
Overlay a real-time higher-timeframe candle on your chart — color-coded bias without switching TFs.
Visualize market asymmetry like never before — steady climbs meet sudden drops with the Donchian PSAR
technical analysis tool designed to provide traders with a structured view of market momentum and volatility
Higher TimeFrame Candle Tracker: Current Timeframe (Any TimeFrame) Show High TimeFrame Candle Bar
Institutional FVG detection with HTF projection, precise volume deltas, and smart fill logic.
Indicator that calculates the slope of a moving average (SMA) and displays the value of the slope in degrees
The traditional Hull Moving Average with different colours based on the slope (direction) of the trend.
8
Sales
285
Free installs