"Coppock Curve" logo
Indicator
34 downloads
Version 1.0, Dec 2025
Windows, Mac
"Coppock Curve" uploaded image
9
Sales
326
Free installs

What is the Coppock Curve?
The Coppock Curve is a long-term momentum indicator originally designed to identify major market bottoms in the S&P 500. It was created in 1962 by economist Edwin Coppock, who was famously asked by the Episcopal Church to find low-risk buying opportunities for their endowment.

In simple terms, it is a trend-following oscillator that tells you when a bear market has likely bottomed out and a new bull market is beginning.

The “Secret Sauce” (How it Works)
Unlike many indicators that are twitchy and reactive, the Coppock Curve is deliberately slow. It is calculated by taking a Weighted Moving Average (WMA) of the sum of two different Rates of Change (ROC).

Coppock = WMA(10) of (ROC(14) + ROC(11))

The Logic:
It measures the rate at which price momentum is changing over long periods (usually 11 and 14 months). By smoothing this data with a weighted average, it filters out almost all short-term market noise.

Fun Fact:
Coppock reportedly asked bishops how long it takes for a person to recover from the grief of losing a loved one. They said “11 to 14 months.” He applied those same timeframes to the market, reasoning that market psychology follows a similar cycle of grief and recovery.

Why is it Useful?
Traders and investors love the Coppock Curve for three main reasons:

  • It Filters the Noise: Because it is calculated on monthly timeframes (traditionally), it ignores day-to-day or even week-to-week volatility. It doesn’t trigger often, but when it does, it’s usually significant.
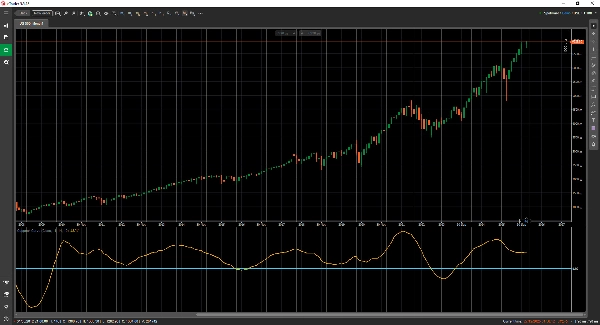
  • Clear Buy Signals: The signal is binary and easy to read. A “Buy” signal is generated when the curve is below the zero line and turns upward (starts rising).
  • Psychological Anchor: It prevents you from trying to “catch a falling knife.” It forces you to wait until momentum has mathematically shifted from negative to positive before entering a position.

When to Use It

  • Best for: Long-term investing, retirement allocations, and identifying the start of a new bull run.
  • Not for: Day trading or shorting. It was not designed to identify sell signals or market tops.
Indicator profile
0.0
Reviews: 0
Customer reviews
No reviews for this product yet. Already tried it? Be the first to tell others!
Indices
RSI
NAS100
Products available through cTrader Store, including trading bots, indicators and plugins, are provided by third-party developers and made available for informational and technical access purposes only. cTrader Store is not a broker and does not provide investment advice, personal recommendations or any guarantee of future performance.

More from this author

Indicator
Forex
Signal
+1
Draw as many Moving Averages as you need from a simple indicator.
cBot
Grid
Forex
+9
This tool will help you spread your trades very quickly with a few clicks
Indicator
Forex
BTCUSD
+3
Visualize market asymmetry like never before — steady climbs meet sudden drops with the Donchian PSAR
Indicator
Signal
Supertrend
Supertrend Scanner – Track trends across assets & timeframes in real-time with alerts. Stay ahead, and trade smarter!
Indicator
Forex
EURUSD
+1
Designed to follow price more naturally, adjusting automatically to market speed, to reduce lag and false signals.
Indicator
Forex
EURUSD
+4
Check the correlations between dozens of assets in one elegant display.
Desktop plugin
Prop
Forex
+5
Place professional OCO & OSO orders in cTrader — visually, instantly, and without execution mistakes.
Indicator
ATR
RSI
+7
Track the Movement of Market Assets with an Oscillator Scanner in Real-Time!
Indicator
Forex
EURUSD
+3
Show each Market Session with full details, including grid mode for higher timeframes, statistics, and other metrics.
cBot
Custom trading dashboard for fast one-click orders. Set Stop Loss, Take Profit, and customize layout & symbols easily.
Indicator
ATR
RSI
+1
Pinpoint, highlight and lock market data easily

You may also like

Indicator
BOS
VWAP
+4
Gold premiun XAUUSD Exclusive Real-Time Adaptive Intelligence
Indicator
VWAP
Moving Average
Vwap Bands it is highly sought after by professional traders because it includes Standard Deviation Bands
Indicator
ATR
Volume
+2
Heatmap Liquidity Zones Visualize volume-at-price, uncover hidden support/resistance, and track market liquidity in real
Indicator
Order Block
Breaker Block
+1
Automatically detects bullish & bearish order blocks and breaker blocks with popup alerts and equilibrium levels.
Indicator
AI
ATR
+20
Algorithmic trend precision for cTrader.
Indicator
ATR
Breaker Block
+5
Display your symbol, timeframe or custom text as a watermark on any chart position with full color and size control.
Indicator
Prop
Forex
+12
⚡ ADXVMA Aurora Trend Filter combines ADX trend strength with an adaptive EMA blend ⚡
Indicator
ATR
RSI
+7
Identifies market imbalances and visually marks key areas based on price patterns and volatility (ATR).
Indicator
Prop
Forex
+2
⚔️ JPY Samurai Breakout Pro — Professional Breakout Indicator for cTrader ⚔️
Indicator
AI
ATR
+27
The Support & Resistance Pro helps traders identify key support and resistance levels for informed trading decisions.
Indicator
BOS
Fibonacci
+4
Automatically draws major trading sessions, killzones, and SMC daily liquidity targets directly on your cTrader charts.
Indicator
Forex
BTCUSD
+6
All-In-One solution for ICT's FVG IFVG ORDERBLOCK in advanced mode.
Indicator
Forex
BTCUSD
+4
The Linear Regression Oscillator (LRO) is a technical indicator based on linear regression analysis.
Indicator
Moving Average
An Indicator made for scalping. Shows you the Sniper movement on Chart with the colour signals.
Indicator
ADX
ATR
+5
Lass System: Non-repainting M5 cTrader indicator with winrate dashboard & multi-asset alerts (Gold, BTC, EURUSD).
"supertrend" logo
Popular
4.3
(3)
$20
Indicator
ATR
Prop
+4
Supertrend Indicator for cTrader
Indicator
ATR
Key Levels
It combines the trend-filtering power of Renko charts with the volatility tracking of ATR Bands
Indicator
RSI
MACD
This indicator is a combination of MACD and RSI into one. This is perfect fusion and powerful indicator ever.
9
Sales
326
Free installs