
Description
This ALGORITHM is an advanced technical tool 🔧 designed to automate the detection of geometric price patterns (Harmonic Patterns) and market structures based on price action. Its primary goal is to identify high-probability potential trend reversal zones 📍.
https://chartshots.spotware.com/c/693330cd99c57
What does this algorithm do?
The algorithm scans the chart in real-time 🔍 looking for specific price formations. It works on two levels:
- Structure Mapping (ZigZag): First, it simplifies market noise by drawing "ZigZag" lines connecting relevant highs and lows (pivots). It uses up to 4 different lengths simultaneously 📏 to capture both small (short-term) and large (long-term) trends.
- Pattern Recognition: Once these pivot points (points A, B, C, D, X) are identified, the algorithm measures the distances and ratios between them. If these ratios match the mathematical rules of classic trading patterns (like Fibonacci), the indicator draws the pattern and alerts the user 🚨.
What is it for?
It serves to eliminate subjectivity when plotting complex patterns and save analysis time ⏳. Instead of manually measuring each Fibonacci retracement and extension, the indicator does it automatically to:
- Detect Reversals: Find points where the price could turn (from bullish to bearish or vice versa). 🔄
- Identify Entry Points: Signal precise zones (the "Potential Reversal Zone") to enter the market. 🎯
- Confirm Analysis: Serve as additional confluence to your own support/resistance strategy.
Logic behind the calculations
The core of the indicator is based on Fibonacci Ratios and market symmetry ⚖️. The algorithm verifies strict rules for each pattern. For example, to confirm a "Gartley" pattern, the algorithm internally calculates:
- If the retracement of point B relative to leg XA is exactly (or very close to) 0.618.
- If the projection of point D meets specific proportions.
The indicator allows for a small margin of error (configurable) because the market is rarely perfect to the exact pip. It also calculates the theoretical Risk/Reward ratio before displaying a pattern.
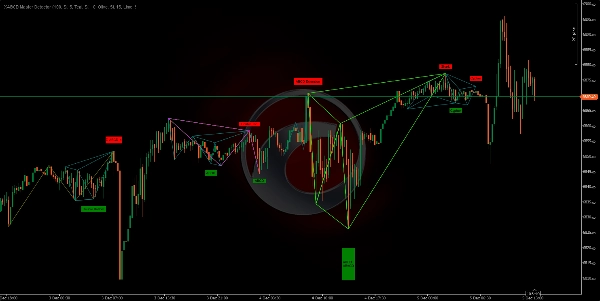
Patterns it detects:
https://chartshots.spotware.com/c/6933314cb9fa1
- Classics: Double Top and Double Bottom. 🏔️🏞️
- Harmonics: Gartley, Bat 🦇, Butterfly 🦋, Crab 🦀, Deep Crab, Shark 🦈, Cypher.
- ABCD Structures: Classic ABCD, AB=CD, Extended ABCD.
- Exotics: Three Drives, 5-0.
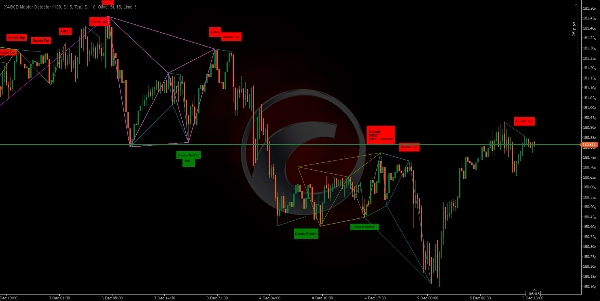
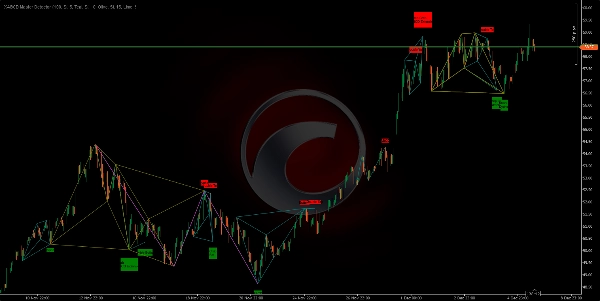
https://chartshots.spotware.com/c/6933317ae4324
How to use it?
Visual Setup:
- You will see colored lines connecting peaks and valleys.
- When a pattern is complete, a colored geometric figure and a label with the pattern name (e.g., "Gartley", "Double Top") will appear.
- Green Labels: Indicate bullish patterns (look for buys). 📈
- Red Labels: Indicate bearish patterns (look for sells). 📉
Interpretation:
- Do not trade every label blindly. Use it as an alert signal.
- When a pattern appears, wait for the price to react in zone D (the pattern's last point).
- Look for additional confirmation (like a Japanese reversal candle or RSI divergence) before entering.
Key Adjustments:
- You can activate or deactivate specific patterns if you only like to trade some (e.g., only "Bat" and "Gartley"). ✅
- You can adjust the sensitivity of the ZigZags to see faster movements or slower trends. ⚙️
🏆 10,000+ Traders Trust Our 25+ Algorithm Suite! 🏆
From Market Structure & Liquidity to Smart Exit Systems & Predictive Tools - we've built EVERY tool you need for consistent.
👉 Access All 25+ PROVEN Systems:
_______________________________________________
📌 Market Structure Indicators
· ✅ AdvancedMarket Structure: Bos, Choch, SwinLevels, Order Blocks, Market Structure& Liquidity Finder
· 🔄 Dynamic Market StructureAnalysis of Turning Points
· 🧱 Order Block
· ⚖️ Market Imbalance
· ⛓️ BOS & CHOCH
· 🧠 ICT Power of 3
_______________________________________________
🔚 Smart Exit Systems
_______________________________________________
📐 ZigZag Indicators
· 🔍 ZigZag Price LiquidityProjection
· ➖ ZigZag
_______________________________________________
🧱 Support & Resistance Indicators
· 🟩 SmartTrend Support &Resistance Lines
· 🧱 All Support and ResistanceLevels
_______________________________________________
📊 Trend & Channel Indicators
· 📊 Supertrend
_______________________________________________
💧 Volume & Liquidity Tools
_______________________________________________
⚡ Momentum & RSI Indicators
· 🔎 Multi-Level Candle Bias
Tracker
_______________________________________________
🔮 Prediction & Projection Tools
· 📐 Prediction Based on Linreg& ATR
· 📏 Fibonacci Linear RegressionMulti-timeframe
· 📈 Volume-Powered Market Flow Projector_________________________
_________________________________________________________________________________________________
_________________________________________________________________________________________________
RSI CHANNEL TRIGGER: 📶
What it is: An indicator that calculates the RSI(period) and visually marks momentum zones when the RSI crosses the overbought/oversold thresholds (default 70/30). ✅
https://chartshots.spotware.com/c/69278f8b6d973
Logic: When a threshold is crossed, it creates a "zone" based on the high/low of the candle at the moment of the crossover. It then: 🧠
- Colors the candles inside that zone.
- Draws a channel (high, low, mid).
- Marks the crossover on the RSI panel with a circle and a label.
The zone lasts for exactly MinZoneDuration bars. ⏱️
Clear signals:
- Crossover above Overbought → initiates a bullish zone. 🟢
- Crossover below Oversold → initiates a bearish zone. 🔴
The zone itself is an area of interest, not an order.
https://chartshots.spotware.com/c/69278fb274e0b
How to use (quick):
- Wait for the zone to form. 🎯
- Confirm with price action (breakout/rejection from the channel lines).
- Enter with a stop loss outside the zone and a target at the mid-channel line or a defined Risk/Reward ratio.
https://chartshots.spotware.com/c/69278fe76237b
Key Parameters: ⚙️
- RSI Period (14)
- Overbought (70)
- Oversold (30)
- MinZoneDuration (15)
- Configurable colors 🎨
Summary
The algorithm recognizes classic and complex patterns—including Double Top/Bottom, Gartley, Bat, Butterfly, Crab, Deep Crab, Shark, Cypher, ABCD structures, and exotic patterns like Three Drives and 5-0—by measuring distances and Fibonacci ratios between pivot points. Upon pattern completion, it visually displays colored geometric figures and labels indicating bullish (green) or bearish (red) signals.
Users can customize pattern detection and ZigZag sensitivity to suit their trading preferences. The indicator supports various markets such as Forex, commodities, indices, stocks, and cryptocurrencies, including symbols like EURUSD, GBPUSD, BTCUSD, XAUUSD, NAS100, and USDJPY.
XABCD Master Detector aims to reduce subjectivity and save analysis time by automatically calculating Fibonacci retracements, extensions, and theoretical risk/reward ratios. It serves as an alert tool to detect reversals, identify entry points, and provide additional confluence to existing support/resistance strategies.
Customer reviews
5 | 100 % | |
4 | 0 % | |
3 | 0 % | |
2 | 0 % | |
1 | 0 % |


