
Description
MarketSessions – Your Trading Edge, Visualized
Turn Market Time Into Trading Power
MarketSessions is a professional-grade cTrader indicator that brings global market sessions to life — so you can trade where momentum is real and timing becomes your edge.
🚀 Why Traders Trust MarketSessions
See the Market Rhythm
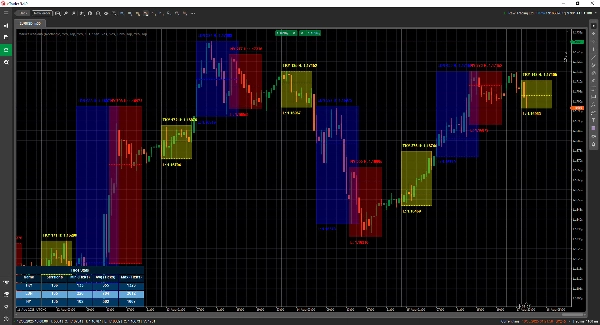
Instantly visualize London, New York, Tokyo, Sydney – and any other session you want – with clean, elegant overlays that adapt to your chart.
Trade Smarter, Not Later
Get real-time notifications when sessions open, close or reach key levels – delivered through Telegram or Discord (your choice).
Attack High-Probability Zones
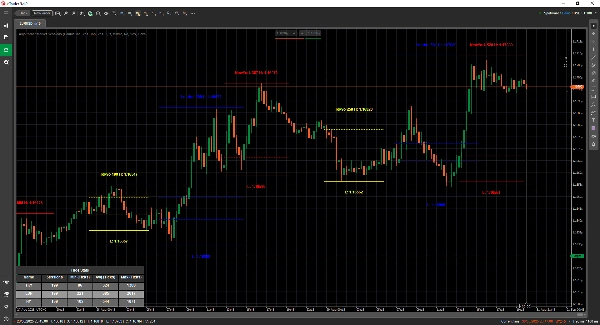
Leverage built-in tools such as the Opening Range Breakout, Point of Control (POC) and precision session lines so you never miss a breakout or rejection.
🎯 Key Features
- Session Visualization & Management – fully customizable times, colors and labels, even for overlapping markets
- Advanced Drawing Tools – includes Double ❘❘ and Middle line drawers, breakout rectangles, text markers and a Double Line Mode for minimalistic traders
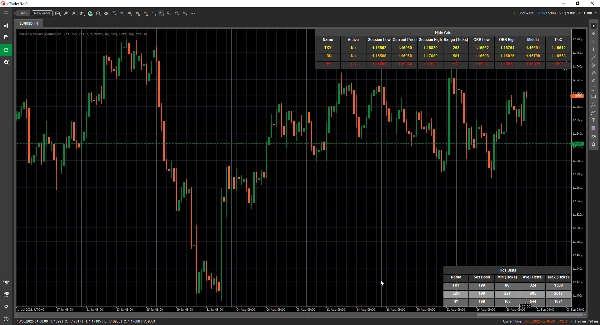
- Statistics Panel – view Total Sessions, Min, Avg and Max ranges for each session (in Ticks, Pips or %)
- Grid Mode - allows you to view the current active sessions in a table, so you can see the sessions in a higher timeframe.
- Flexible Configuration – customize text placement, range modes, drawing preferences and themes
- Alerts & Integrations – Telegram/Discord integration with sound and visual alerts
📦 What You Get
- MarketSessions.algo (ready to use)
- Lifetime Updates (no recurring fees)
- Friendly Support (direct access if you need help)
💻 Requirements
- cTrader platform
- .NET 6.0 runtime
✅ Install in minutes
✅ Trade with absolute confidence
📘 Parameter Reference (Friendly Version)
List of Sessions Available
- New York
- London
- Frankfurt
- Tokyo
- Hong Kong
- Shanghai
- Singapore
- Wellington
- Sydney
- Toronto
General Settings
- Drawing Mode – Choose how session lines are drawn on the chart (Rectangle / Double Line / Middle Line)
- Show Session Name – Display the name of each session directly on your chart
- Session Name Location – Decide where the session name text appears (top, center, bottom)
- Text Bold – Makes the session name bold so it’s easier to read
- Top Text Offset – Adds extra spacing from the top (so text doesn’t overlap candles)
- Bottom Text Offset – Adds extra spacing from the bottom of the session area
- Text Time Location – Show the session time along with the session name
- Use Short Session Name – Switches to shorter names (e.g. NY instead of New York)
- Show Session Range – Highlight the full price range covered by the session
- Session Range Mode – Choose how the price range is calculated (high/low or open/close)
- Session Range Location – Place the range marker either at the top or bottom of the range
- Show High – Display the session’s highest price
- Show High Location – Choose where the High label appears
- Show Low – Display the session’s lowest price
- Show Low Location – Choose where the Low label appears
- Extend High/Low Lines (Minutes) - Allows extending these lines for x minutes forward
- Show Opening Range Breakout – Draw a breakout box at the session open
- Extend ORB Lines (Minutes) - Allows extending these lines for x minutes forward
- Show Middle Lines – Add midlines to help identify fair value
- Extend Middle Lines (Minutes) - Allows extending this line for x minutes forward
- Show PoC – Display the Point of Control (most traded price of the session)
- Extend Middle Lines (Minutes) - Allows extending this line for x minutes forward
- Filled Transparency – Control how transparent the background fill of the session is
Statistics
- Draw Statistics – Show/hide the statistics panel on your chart
- Stats Horizontal Alignment – Align the panel (Left / Center / Right)
- Stats Vertical Alignment – Choose whether the panel appears on top or bottom
- Title Color – Text color for the “Statistics” title
- Even Row Color – Background color for even-numbered rows in the panel
- Odd Row Color – Background color for odd-numbered rows in the panel
- Foreground Color – Text color used inside the panel
Telegram
- Use – Enable or disable Telegram alerts
- Token – Your Telegram Bot token
- ChatId – The chat ID where alerts will be sent
Discord
- Use – Enable or disable Discord alerts
- WebhookUrl – Discord webhook URL for sending session alerts
Sound Alerts
- New Session Sound Alert – Play a sound when a new session begins
- Session Completed Sound Alert – Play a sound when a session ends
Grid
- Force Grid - Forces rendering the grid irrespective of the TimeFrame used
- Grid Visible for Above TimeFrame - Let's you select at which Timeframe and beyond this Grid is visible
- Message Box Notification - Notifies why the normal rendering mode is not possible and switches to the Grid Mode
- Grid Horizontal Alignment
- Grid Vertical Alignment
Session Example (New York)
⚠️ Same parameters apply to each session (London, Tokyo, Sydney, etc.)
- Active – Enable or disable this specific session
- Color – Session color used on the chart
- Fill Region – Fill the background of the session area
- Line Style – Choose line style (solid, dashed, etc.)
- Line Thickness – Control the thickness of the session borders
Make the market’s clock your ally
Get MarketSessions today and never miss a profitable session again.
Summary
Users can view comprehensive session statistics, including total sessions, minimum, average, and maximum ranges measured in ticks, pips, or percentages. A grid mode enables viewing active sessions in a table format suitable for higher timeframes. The indicator supports real-time alerts via Telegram or Discord for session openings, closings, and key levels, complemented by sound and visual notifications.
Additional configurable options include display preferences for session names, price ranges, high/low prices, opening range breakouts, middle lines, and the Point of Control (most traded price). The indicator requires the .NET 6.0 runtime and offers lifetime updates and support. It is applicable to major forex symbols such as EURUSD, GBPUSD, NZDUSD, and USDJPY.
Customer reviews
5 | 100 % | |
4 | 0 % | |
3 | 0 % | |
2 | 0 % | |
1 | 0 % |


