
Rsi buy Sell Signal
Indicator
337 downloads
Version 1.0, Aug 2025
Windows, Mac
4.0
Reviews: 1
Description
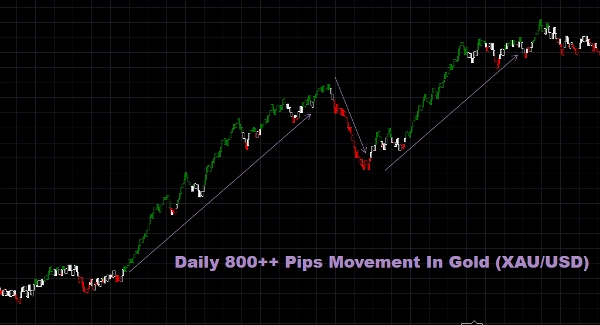
Elevate your scalping game with RSI Scalping. Its RSI analysis triggers rapid trades on volatile indexes and forex pairs, while dynamic exit management locks in quick profits. With intuitive controls, it’s perfect for both new and experienced scalpers.
Summary
AI summary
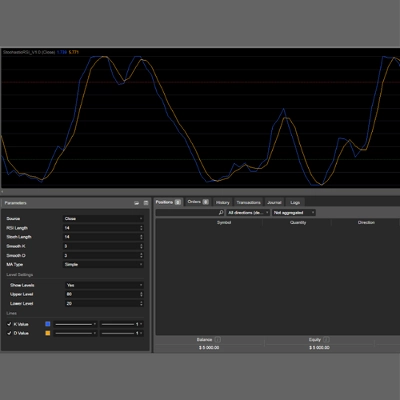
RSI Buy Sell Signal is an indicator designed for scalping in volatile markets, specifically targeting turbulent indexes and forex pairs. It uses Relative Strength Index (RSI) analysis to generate rapid trade signals, enabling quick entry and exit decisions. The indicator features dynamic exit management to help secure profits efficiently. Its intuitive controls make it accessible for both novice and experienced scalpers. This tool is intended to support fast-paced trading strategies by providing timely buy and sell signals based on RSI movements.
Indicator profile
Customer reviews
4.0
Reviews: 1
5 | 0 % | |
4 | 100 % | |
3 | 0 % | |
2 | 0 % | |
1 | 0 % |
Customer reviews
Discussion
FAQ
Products available through cTrader Store, including trading bots, indicators and plugins, are provided by third-party developers and made available for informational and technical access purposes only. cTrader Store is not a broker and does not provide investment advice, personal recommendations or any guarantee of future performance.


Price
Since 03/08/2025
337
Free installs