Opis
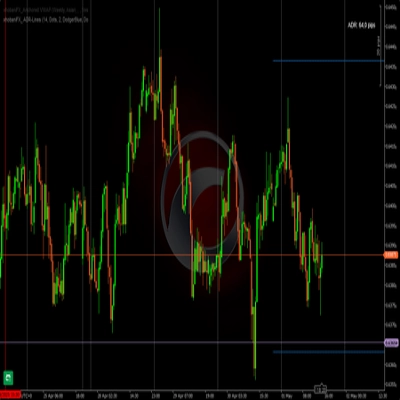
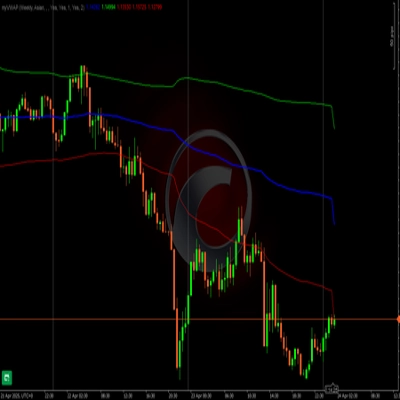
Zakotwiczony VWAP
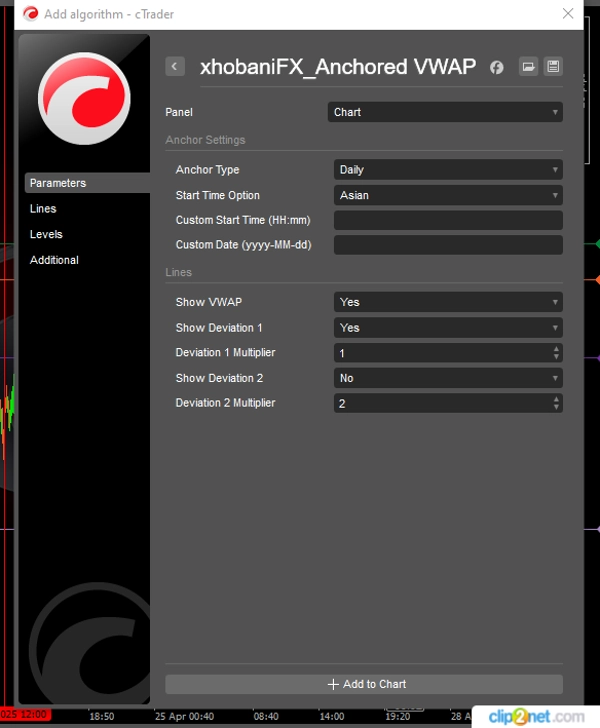
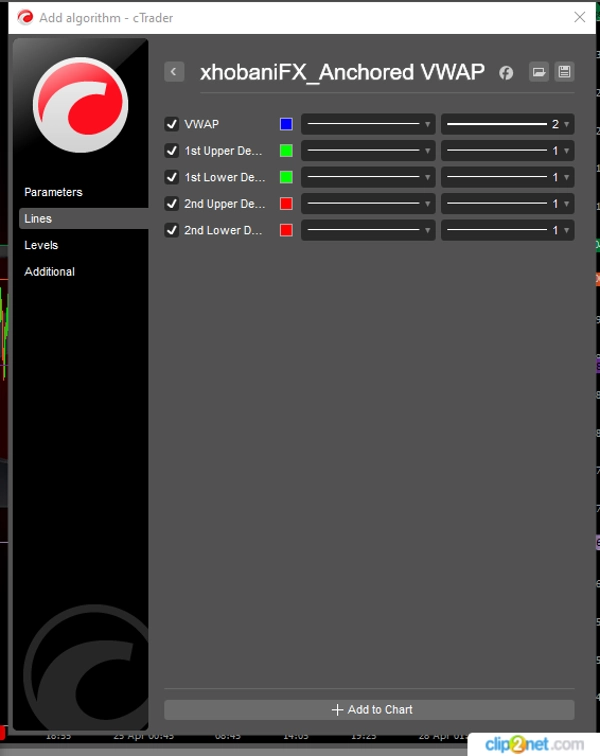
Ten VWAP posiada specjalną funkcjonalność. Po ustawieniu okresu kotwicy, Twój VWAP i preferowane odchylenia nie zmieniają się podczas zmiany interwałów czasowych. Osobiście używam tego wskaźnika w moim day-tradingu i analizie. Trader może wybrać spośród trzech okresów kotwicy, tj. dzienny, tygodniowy i miesięczny. Chcesz użyć luki rynkowej, lokalnego maksimum/minimum jako kotwicy? Mam to dla Ciebie. Możesz także dostosować wybrany punkt kotwicy, wpisując datę i godzinę rozpoczęcia kotwicy w parametrach tego wskaźnika.
xhobani_FX stawia na przyjazność dla użytkownika, optymalizację i wydajność. Wzięto pod uwagę i uwzględniono wyzwania rzeczywistego handlu. Ciągle testuję, aktualizuję i ulepszam wszystkie moje wskaźniki. Satysfakcja klienta jest kluczowa... a może powiem, że satysfakcja tradera jest kluczowa. Mam nadzieję, że spełni Twoje oczekiwania i wrócisz po więcej!
Szczęśliwego handlu!
Podsumowanie
Opinie klientów
5 | 100 % | |
4 | 0 % | |
3 | 0 % | |
2 | 0 % | |
1 | 0 % |