Descrizione
Linee ADR Alte e Basse
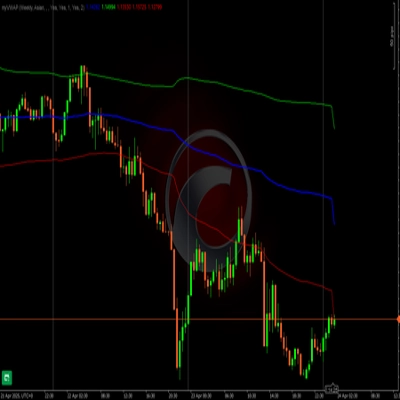
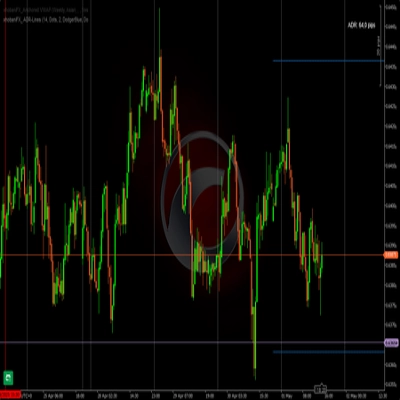
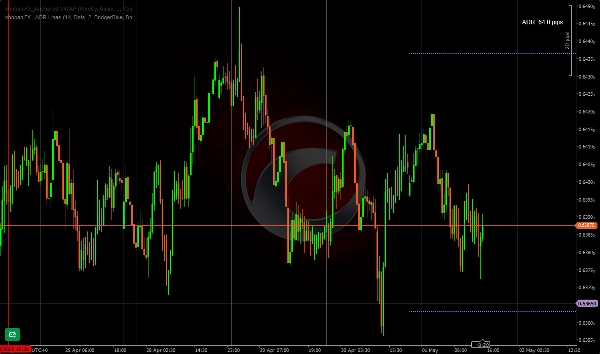
Questo indicatore ADR traccia linee orizzontali per il minimo/massimo del giorno corrente basandosi sul periodo preferito dal trader. Io preferisco e uso 14 giorni come periodo di riferimento. È più adatto per scalper/trader intraday. Così puoi facilmente notare quando è stato raggiunto un massimo/minimo, puoi scegliere il colore/stile/spessore delle linee per cambiarle in un colore diverso a tua scelta una volta raggiunte.
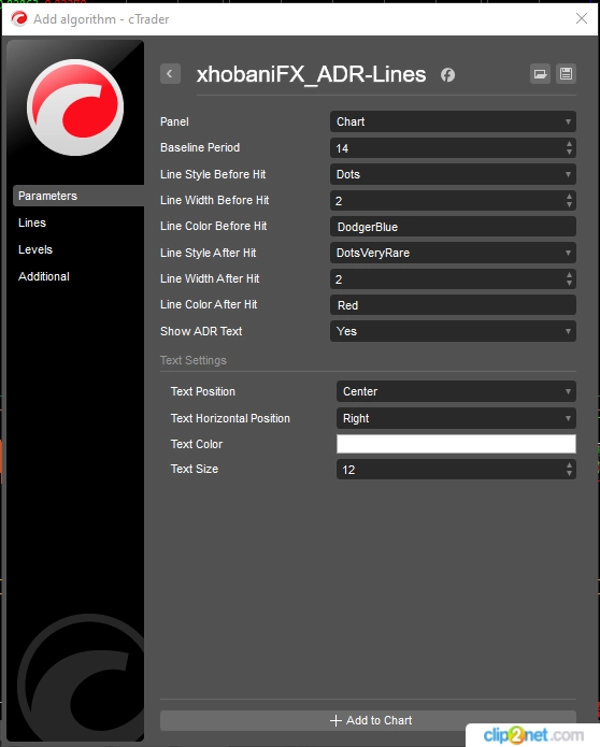
Questo indicatore è sviluppato in modo tale da permetterti di personalizzare la maggior parte dei suoi parametri per adattarli alle tue preferenze e allinearti con il tuo spazio di lavoro e i colori.
Buon trading!
xhobani_FX
Riepilogo
Riepilogo AI
xhobaniFX_ADR-Lines is an Average Daily Range (ADR) indicator designed for scalpers and intraday traders. It plots horizontal lines representing the current day's high and low levels based on a user-defined period, with 14 days commonly used as a baseline. The indicator visually highlights when these high or low levels are reached by allowing customization of line color, style, and width to change upon being hit. Most parameters are adjustable to fit individual trading preferences and workspace aesthetics. This tool aids traders in quickly identifying key price levels within the trading day.
Profilo indicatore
Recensioni dei clienti
4.0
Recensioni: 2
5 | 0 % | |
4 | 100 % | |
3 | 0 % | |
2 | 0 % | |
1 | 0 % |
Discussioni
Domande frequenti
I prodotti disponibili tramite cTrader Store, inclusi bot di trading, indicatori e plugin, sono forniti da sviluppatori terzi e resi disponibili esclusivamente a scopo informativo e di accesso tecnico. cTrader Store non è un broker e non fornisce consulenze in materia di investimento, raccomandazioni individualizzate o garanzie di risultati futuri.