

Açıklama
WeTrade Trendline Breakout, dinamik trend çizgisi analizi kullanarak yüksek olasılıklı kırılma fırsatlarını tespit eden akıllı bir fiyat hareketi göstergesidir. Piyasa yapısını otomatik olarak tanımlar, geçerli trend çizgilerini çizer ve fiyat önemli seviyeleri kırdığında kesin alım/satım sinyalleri üretir. Dahili hedef projeksiyonları ve volatiliteye dayalı tamponlar, yatırımcıların riski yönetmesine ve ödülü güvenle maksimize etmesine yardımcı olur.
Hedeflerle Trend Çizgisi Kırılmaları
Trend çizgisi kırılmalarını otomatik olarak tespit eden ve dinamik hedef seviyeleri ile net giriş sinyalleri sağlayan akıllı bir fiyat hareketi göstergesi.
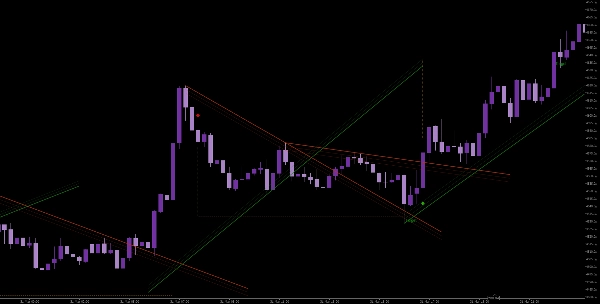
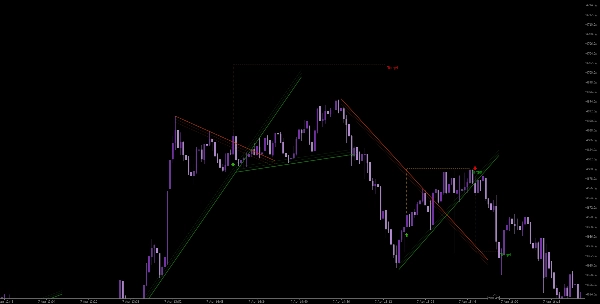
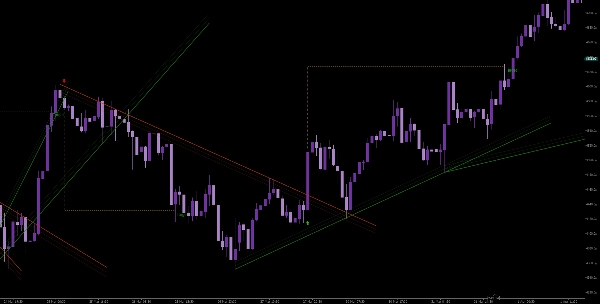
Bu araç, gerçek piyasa yapısına dayalı geçerli trend çizgileri çizmek için pivot yüksek ve düşükleri tanımlar. Fiyat, azalan direnç veya yükselen destek trend çizgisini kırdığında, yanlış kırılmaları azaltmak için kapanış onay mantığı kullanarak kesin alım veya satım sinyalleri üretir.
Gösterge, ATR kullanarak uyarlanabilir volatilite filtresi içerir ve kırılma doğruluğunu artırmak için trend çizgileri etrafında tampon bölgeler (Z-Bantları) oluşturur. Geçerli bir kırılma gerçekleştiğinde, otomatik olarak kar al hedefleri ve zarar durdur seviyeleri çizer, böylece yatırımcıların riski ve ödülü verimli bir şekilde yönetmesine yardımcı olur.
Ana özellikler:
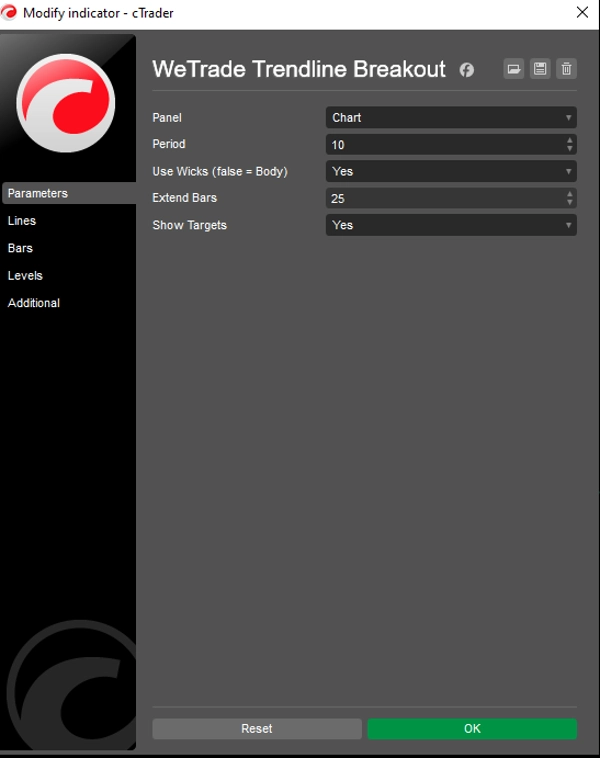
- Pivot yapısı kullanarak otomatik trend çizgisi tespiti
- Onay mantığı ile kırılma sinyalleri
- ATR tabanlı dinamik tampon bölgeler (Z-Bantları)
- Dahili kar al ve zarar durdur görselleştirmesi
- İsteğe bağlı hedef seviyelerle temiz grafik görüntüleme
- Tüm enstrümanlar ve zaman dilimlerinde çalışır
Yapıya, momentuma ve disiplinli uygulamaya odaklanan yatırımcılar için tasarlanmıştır.
Özet
Key features include ATR-based dynamic buffer zones (Z-Bands) that adapt to market volatility, enhancing breakout accuracy. Upon a confirmed breakout, the tool automatically plots take-profit targets and stop-loss levels, aiding in risk and reward management. The indicator offers a clean chart display with optional target visualization and supports all instruments and timeframes.
This tool is suitable for traders focusing on market structure, momentum, and disciplined trade execution across various markets including Forex, cryptocurrencies, commodities, indices, and stocks. It provides breakout signals and trend strength insights based on price action and volatility measures.
Müşteri değerlendirmeleri
5 | 100 % | |
4 | 0 % | |
3 | 0 % | |
2 | 0 % | |
1 | 0 % |


!["[Stellar Strategies] Market Structure Breakout" logosu](https://cdn.ctrader.com/image/webp/bceec265-3247-4b11-915f-6295a29c106d_28465)


