Opis
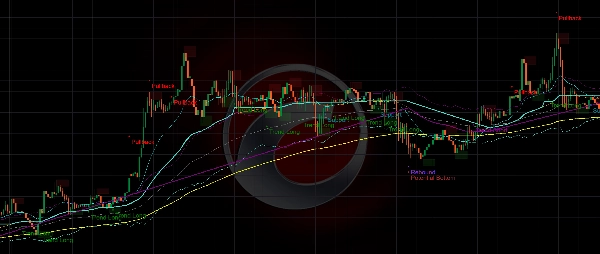
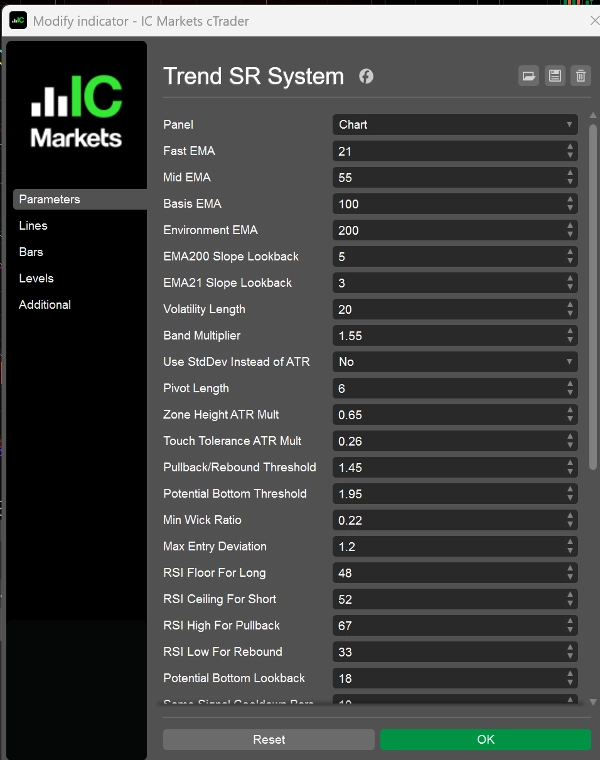
Trend SR System to wskaźnik wykresu ukierunkowany na trendy, zaprojektowany, aby pomóc traderom w wyraźniejszym identyfikowaniu kontekstu rynkowego, kluczowej struktury EMA, dynamicznych poziomów wsparcia/oporu oraz potencjalnych stref kontynuacji lub krótkoterminowej rewizji średniej.
Wskaźnik opiera się na EMA21, EMA55, EMA100 i EMA200:
- EMA200 jest używana jako filtr środowiska rynkowego na wyższym poziomie
- EMA100 działa jako centralna oś cenowa i linia bazowa pasma
- EMA55 pomaga identyfikować średnioterminowy nacisk wsparcia i oporu
- EMA21 służy do śledzenia krótkoterminowego rytmu, cofnięć i korekt
Ponadto wskaźnik łączy pasma zmienności, strefy strukturalne oparte na pivotach oraz logikę dynamicznego wsparcia/oporu w stylu krokowym, aby zapewnić bardziej uporządkowany obraz rynku.
Główne cechy
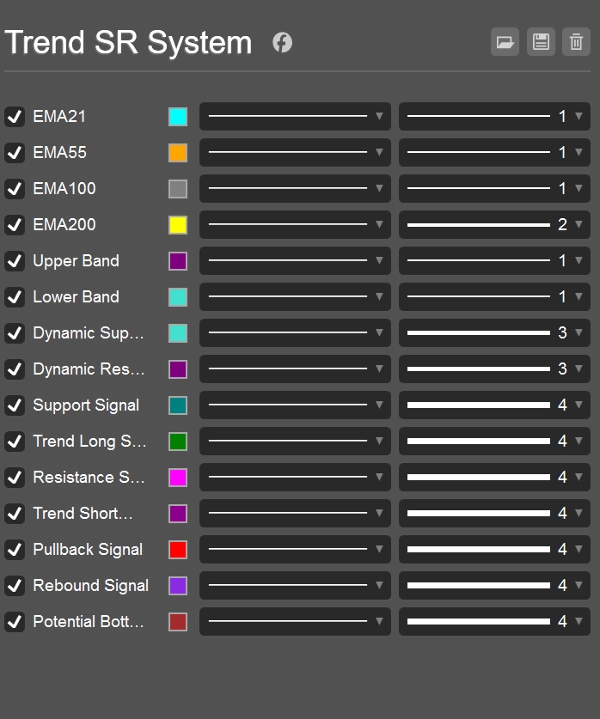
- Wyświetla 4 kluczowe linie struktury EMA
- Pokazuje górne i dolne pasma oparte na ATR lub odchyleniu standardowym
- Generuje dynamiczne poziomy wsparcia i oporu
- Wykrywa strukturalne obszary wsparcia/oporu za pomocą logiki pivotów
- Dostarcza sygnały typu kontynuacji i krótkoterminowej korekty
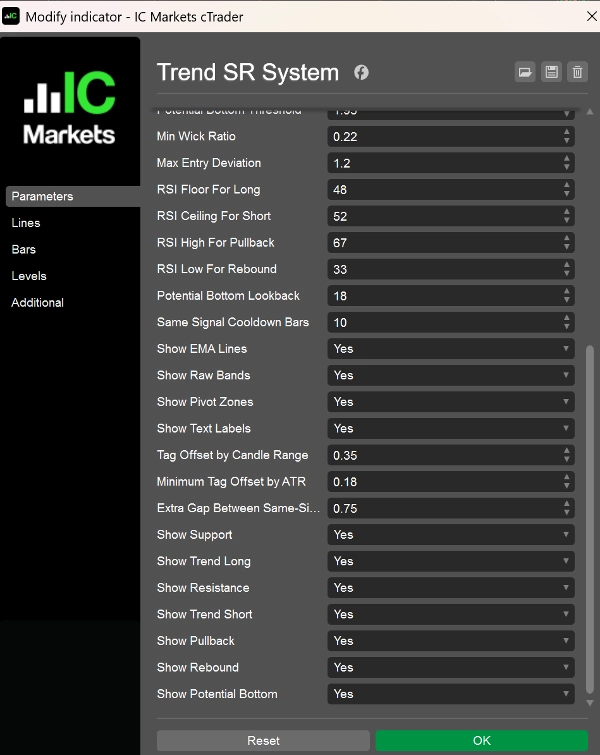
- Pozwala na włączanie lub wyłączanie poszczególnych typów sygnałów
Typy sygnałów
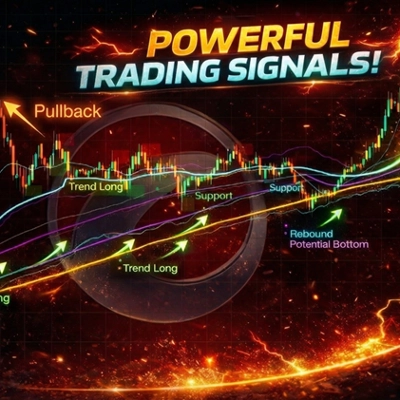
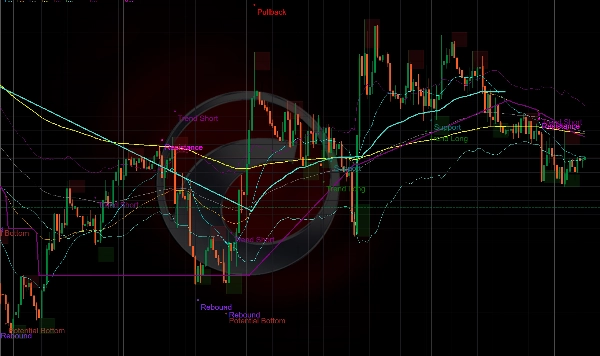
- Wsparcie
Kluczowy obszar wsparcia w środowisku byczym, sugerujący, że cena jest broniona po cofnięciu. - Trend Long
Sygnał długiej pozycji podążający za trendem na rynku byczym, zwykle pojawiający się po wznowieniu impetu wzrostowego po cofnięciu. - Opór
Kluczowy obszar oporu w środowisku niedźwiedzim, sugerujący, że cena jest ograniczana po korekcie. - Trend Short
Sygnał krótkiej pozycji podążający za trendem na rynku niedźwiedzim, zwykle pojawiający się po utracie siły odbicia i wznowieniu trendu spadkowego. - Cofnięcie
Krótkoterminowe ostrzeżenie o nadmiernym rozciągnięciu w środowisku byczym, sugerujące możliwe ryzyko cofnięcia lub konsolidacji. - Odbicie
Krótkoterminowe ostrzeżenie o wyprzedaniu w środowisku niedźwiedzim, sugerujące możliwe ryzyko technicznego odbicia. - Potencjalne dno
Silniejszy sygnał typu odbicia po wyprzedaniu, wskazujący na możliwą próbę utworzenia tymczasowego dna.
Typowe zastosowania
Ten wskaźnik nadaje się do:
- Analizy podążającej za trendem
- Określania momentu wejścia po cofnięciu i korekcie
- Obserwacji struktury EMA oraz wsparcia/oporu
- Monitorowania nadmiernie rozciągniętych warunków byczych lub niedźwiedzich
- Filtrowania transakcji na podstawie wykresu i wspomagania decyzji dyskrecjonalnych
Może być stosowany na rynku forex, indeksach, metalach, kryptowalutach i innych rynkach trendowych.
Najlepszy dla
Ten wskaźnik jest przeznaczony dla traderów, którzy:
- Chcą mieć wyraźniejszy i bardziej uporządkowany widok wykresu
- Skupiają się na kontynuacji trendu i kluczowych strefach reakcji
- Używają struktury EMA wraz z zachowaniem ceny oraz wsparciem/oporem
- Preferują wizualne wsparcie handlu dla ustawień krótkoterminowych i średnioterminowych
Uwagi dotyczące użytkowania
- Najlepiej używać razem z kontekstem rynkowym i solidnym zarządzaniem ryzykiem
- Sygnały nie powinny być traktowane jako samodzielne porady handlowe
- Jakość sygnałów może się pogorszyć podczas zmiennego lub niskowolumenowego rynku
- Jest to narzędzie do analizy wykresów i wsparcia decyzji handlowych, a nie system gwarantujący wyniki
Podsumowanie
It provides multiple signal types including support, resistance, trend-following longs and shorts, pullback warnings, rebounds, and potential bottom formations. These signals assist in identifying continuation setups and short-term mean-reversion opportunities. Users can enable or disable individual signal types according to their preferences.
Designed for use across forex, indices, commodities, metals, cryptocurrencies, and other trending markets, the Trend SR System supports trend-following analysis, entry timing on pullbacks, and monitoring of EMA structure alongside price behavior. It is intended as a chart analysis and trade support tool to enhance visual clarity of market context and key reaction zones, best used in conjunction with sound risk management and broader market analysis.
Opinie klientów
5 | 0 % | |
4 | 100 % | |
3 | 0 % | |
2 | 0 % | |
1 | 0 % |