
설명
▁▂▃▄▅▆▇ █ 10,000+ 트레이더 (기관 + 소매) █ ▇▆▅▄▃▂▁
- cTrader에서 우리의 TOP 지표를 선택하세요 🏆
- ✨ 우수한 결과를 위한 독점적인 정밀도 ✨
- 📈 최고 평점을 받은 시각적 요소를 가진 우리의 알고리즘 🎯
- 2개의 퀀트 펀드에 성공적으로 적용되었습니다
▁▂▃▄▅▆▇ █████████████████████████████ ▇▆▅▄▃▂▁
_______________________________________________
_______________________________________________
📌 시장 구조 지표
· ✅ AdvancedMarket Structure: Bos, Choch, SwinLevels, Order Blocks, 시장 구조& 유동성 탐색기
· 🔄 동적 시장 구조 전환점 분석
· 🧱 주문 블록
· ⚖️ 시장 불균형
· ⛓️ BOS & CHOCH
· 🧠 ICT Power of 3
· 🌀 시장 극성 구역
______________________________________________________________-
스토어 cBots : 🧠 금 & BTC 돌파세션 피벗 🧠
_______________________________________________
🔚 스마트 종료 시스템
· 📍 추적 스마트 알고리즘
_______________________________________________
📐 지그재그 지표
· 🔍 지그재그 가격 유동성 투영
· 🧭 S&R 구조적 지그재그
· ➖ 지그재그
· 🎯 지그재그 극단 추적기
_______________________________________________
🧱 지지 및 저항 지표
· 🟩 스마트트렌드 지지 및 저항선
· 🧱 모든 지지 및 저항 레벨
_______________________________________________
📊 추세 및 채널 지표
· 🔄 자동 추세 채널
· 📊 슈퍼트렌드
· ⚡모멘텀 추세 분석기
· 🧠 적응형 추세 채널
· 💥 채널 돌파 시스템
· 🌈 동적 추세 그라데이션
· ⭐ 프리미엄 SSL 채널
· 🔁 반응형 이동 평균
_______________________________________________
💧 거래량 및 유동성 도구
· 🔥 거래량 POC 히트맵
· 📉 레버리지 청산 지도
· 🔍 모멘텀 공정 가치 갭
· 🕒 공정 가치 갭 세션
_______________________________________________
⚡ 모멘텀 및 RSI 지표
· 📈 RSI 추세 트리거
· 🚀 동적 범위 모멘텀
_______________________________________________
🔮 예측 및 투영 도구
· 📈 거래량 기반 시장 흐름 투영기
📉 피보나치 피치팬
______________________________________________________________________________________________________
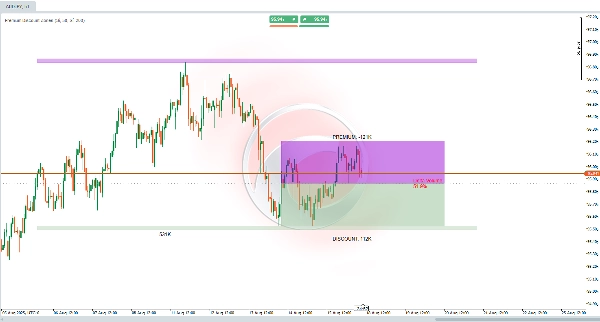
프리미엄 할인 구역 지표는 무엇을 하나요? 🎯
이 지표는 최근 시장 고점과 저점을 기반으로 핵심 영역을 식별하는 데 도움을 줍니다. 과거 바의 구성 가능한 기간을 분석하여 일반적인 가격 범위를 결정하고, 중간 균형점을 계산하며, 그 범위를 두 개의 주요 구역으로 나눕니다:
- 🔺 프리미엄 (상위 구역)
- 🟩 할인 (하위 구역)
또한 해당 바의 거래량을 평가하여 "거래량 델타"를 계산하는데, 이는 약세 움직임과 관련된 거래량의 백분율을 나타냅니다.
용도는 무엇인가요? 💡
이 지표는 가격이 다음과 같은 영역에 있을 수 있음을 식별하는 데 도움을 줍니다:
- 📈 과대평가됨 (프리미엄 구역) → 매도 또는 이익 실현 가능성
- 📉 과소평가됨 (할인 구역) → 매수 또는 축적 가능성
시장 불균형을 빠르게 보여주며, 최근 거래량이 강세 또는 약세 움직임 중 어느 쪽에 유리한지 강조합니다. 확장된 구조적 구역은 즉각적인 범위를 넘어 주요 레벨을 투영하여 추세나 반전 거래 계획에 유용합니다. 🚀
통합 범위, 돌파, 기관 거래 또는 유동성 분석을 목표로 하는 전략에 완벽합니다!
해석 방법은? 🔍
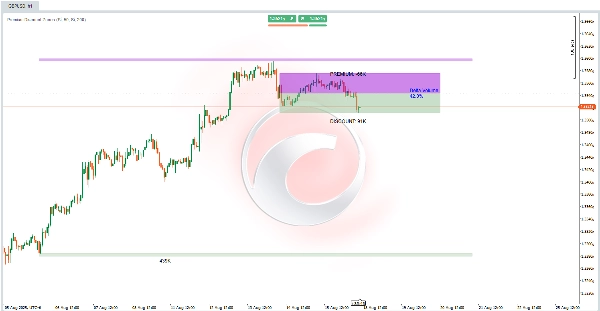
- 🟣 프리미엄 구역 (보라색, 균형점 위) → 가격이 "비싸다"고 여겨지는 상위 범위
- 🟢 할인 구역 (녹색, 균형점 아래) → 가격이 "저렴하다"고 여겨지는 하위 범위
- ⚖️ 균형선 (회색, 중간) → 범위의 중간점을 표시하며 균형 레벨 역할을 합니다. 이곳에서 가격 교차는 편향 변화를 신호할 수 있습니다.
- 📊 거래량 델타 (중앙) → 약세 거래량 %를 보여줍니다(🔴 >50% = 약세, 🔵 <50% = 강세).
- 🏛 구조적 구역 (음영 확장) → 범위 극단 위/아래의 확장 영역으로, 최근 가격 움직임을 기반으로 한 버퍼와 함께 장기 지지/저항 역할을 합니다.
이 지표는 최근 바에서 이 구역들을 동적으로 업데이트하며, 미래 투영을 위해 오른쪽으로 확장합니다.
거래에 어떻게 사용하나요? 🛠️
- 초기 설정:
-
- 원하는 경우 PD 레벨(주요) 및 구조적 구역을 활성화하세요.
- 조회 기간을 조정하세요:
-
- 짧음 (예: 50 바) → 최근 범위
- 김 (예: 200 바) → 구조적 맥락
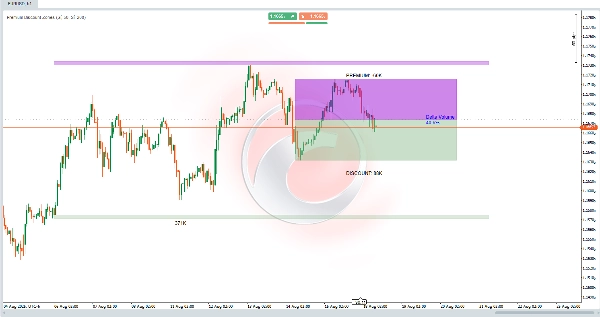
- 차트 분석 (예: H1 타임프레임):
-
- 가격이 🟣 프리미엄 (약세 확인 시 매도 고려) 또는 🟢 할인 (강세 확인 시 매수 고려) 구역에 있는지 확인하세요.
- 확인을 위해 거래량 델타를 사용하세요:
-
- 🔴 >50% → 프리미엄에서 숏을 선호
- 🔵 <50% → 할인에서 롱을 선호
- 진입 및 청산 전략:
-
- 🟢 할인 구역에서 매수: 가격이 녹색 구역에 진입하고 델타가 낮으면, 구역 하단 아래에 손절매를 두고 균형선 또는 프리미엄을 목표로 하는 롱 진입을 찾으세요.
- 🟣 프리미엄 구역에서 매도: 가격이 보라색 구역에 도달하고 델타가 높으면, 구역 상단 위에 손절매를 두고 균형선 또는 할인 구역을 목표로 하는 숏을 고려하세요.
- 🏛 구조적 구역 사용은 장기 거래에 적용하며, 버퍼를 오차 범위로 활용하세요.
요약
The indicator also computes a Volume Delta, representing the percentage of volume associated with bearish movements, which helps confirm market bias: values above 50% favor bearish conditions, while values below 50% favor bullish conditions. Extended structural zones project key support and resistance levels beyond the immediate range, useful for planning trades in trending or reversal markets.
Users can adjust lookback periods to focus on recent ranges or broader structural context. The indicator dynamically updates these zones and extends them forward for future projections. It supports trading strategies involving consolidation ranges, breakouts, institutional trading, and liquidity analysis by providing visual cues on price valuation and volume-driven market imbalances.


!["[Stellar Strategies] MARSI Signal Plotter" 로고](https://cdn.ctrader.com/image/webp/7b2b8da6-8f8e-4646-8d4a-4710c516c01e_25567)
