คำอธิบาย
ปัญหา: ข้อมูลล้นหลาม
เทรดเดอร์ส่วนใหญ่ล้มเหลวเพราะกราฟของพวกเขามีตัวชี้วัดที่ล้าช้าและเส้นมากเกินไป พวกเขาสูญเสียสิ่งที่สำคัญที่สุด: โครงสร้างตลาด.
ทางแก้: โครงสร้างแนวโน้ม
ตัวชี้วัดนี้เป็น "สองในหนึ่ง" ที่ทรงพลังสำหรับแพลตฟอร์ม cTrader มันผสานรวม การตรวจจับสวิง ระดับมืออาชีพเข้ากับ เครื่องยนต์การให้คะแนน ที่บอกคุณอย่างชัดเจนว่าใครเป็นผู้ควบคุมตลาด
คุณสมบัติหลัก:
- การทำแผนที่โครงสร้างอัจฉริยะ: ระบุระดับแนวรับและแนวต้านที่สำคัญโดยอัตโนมัติด้วยความผันผวนที่กรองด้วย ATR.
- เครื่องยนต์การให้คะแนน SGE: ระบบการให้คะแนนเฉพาะ (-2, 0, +2) ที่คำนวณความแข็งแกร่งของแนวโน้มตามจำนวนระดับโครงสร้างที่ถูกทำลาย.
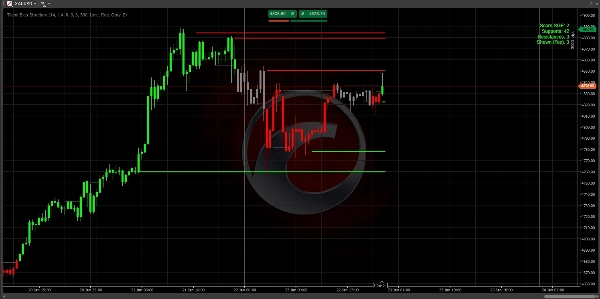
- เทคโนโลยีป้องกันความยุ่งเหยิง: แสดงเฉพาะ 3 ระดับที่เกี่ยวข้องใกล้เคียงกับราคาปัจจุบัน กราฟของคุณจะสะอาด มืออาชีพ และใช้งานได้จริง.
- การตรวจจับโมเมนตัม: ใช้ตรรกะ "แท่งเทียนใหญ่" เพื่อให้แน่ใจว่าคุณเทรดเฉพาะการเคลื่อนไหวที่มีการสนับสนุนจากสถาบันจริง.
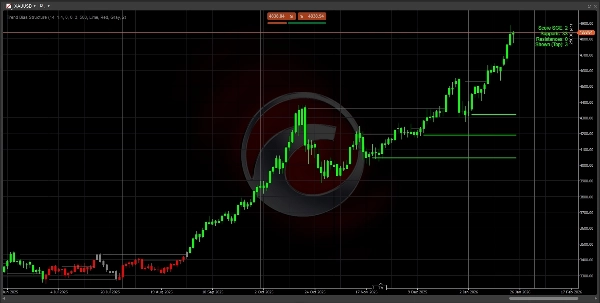
- ปรับแต่งได้เต็มที่: ปรับความไวให้เหมาะกับสินทรัพย์เฉพาะของคุณ (XAUUSD, Forex หรือดัชนี).
วิธีการเทรดกับมัน:
- ตรวจสอบคะแนน: มองหา +2 (ขาขึ้น) หรือ -2 (ขาลง).
- รอการดึงกลับ: ให้ราคากลับไปยัง เส้นโครงสร้าง ที่วาดไว้.
- ดำเนินการ: เทรดตามแนวโน้มโดยใช้ระดับเหล่านี้เป็นจุดเข้า/ออก.
ข้อมูลทางเทคนิค
- แพลตฟอร์ม: cTrader
- ภาษา: C# (.NET)
- กรอบเวลา: ใช้งานได้กับทุกกรอบเวลา (M1 ถึงรายเดือน).
- สินทรัพย์: ปรับแต่งสำหรับคู่สภาพคล่องสูง (XAUUSD, EURUSD, GBPUSD).
หมายเหตุ: การตั้งค่าเริ่มต้น: สำหรับคู่หลักส่วนใหญ่ การตั้งค่าเริ่มต้นได้รับการปรับแต่งแล้ว หากคุณเทรดดัชนีที่ผันผวน คุณอาจต้องเพิ่ม Range Global ATR Mult เป็น 2.0
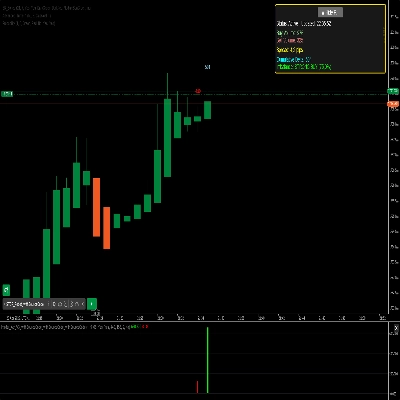
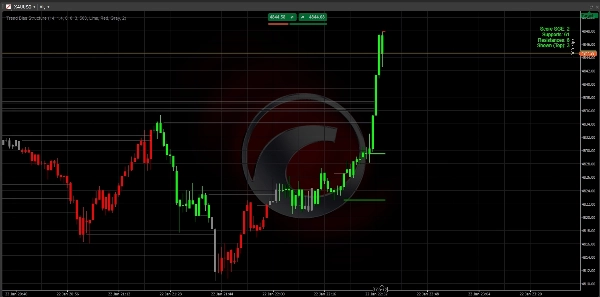
สำคัญ: การอ่านแดชบอร์ด
แดชบอร์ดที่มุมบนขวาคือศูนย์บัญชาการของคุณ:
- คะแนน +2 (สีเขียว): ขาขึ้นแข็งแกร่ง มองหาเฉพาะการตั้งค่า ซื้อ เท่านั้น.
- คะแนน -2 (สีแดง): ขาลงแข็งแกร่ง มองหาเฉพาะการตั้งค่า ขาย เท่านั้น.
- คะแนน 0 (สีเทา): เป็นกลาง ตลาดกำลังเคลื่อนไหวในช่วงหรืออยู่ในช่วงเปลี่ยนผ่าน รออย่างอดทน.
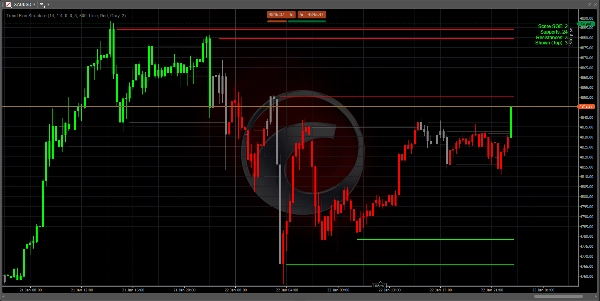
- แนวรับ/แนวต้าน: แสดงจำนวน "พื้น" และ "เพดาน" ทางประวัติศาสตร์ที่มีอยู่ในแนวโน้มปัจจุบัน.
กลยุทธ์เข้าตลาด 3 ขั้นตอน
ขั้นตอนที่ 1: ระบุแนวโน้ม รอให้สีแท่งเทียนและคะแนนแดชบอร์ดถึง +2 หรือ -2 ซึ่งยืนยันว่าตลาดได้ทำลายโครงสร้างและแนวโน้มกำลังเริ่มต้น.
ขั้นตอนที่ 2: พื้นที่มูลค่า อย่าไล่ราคาขึ้นไป รอให้ราคาดึงกลับ (รีเทรซเมนต์) ไปยัง 3 เส้นที่ใกล้ที่สุด ที่วาดบนกราฟของคุณ.
- ในแนวโน้มขาลง (คะแนน -2) รอให้ราคาสัมผัส เส้นสีแดง.
- ในแนวโน้มขาขึ้น (คะแนน +2) รอให้ราคาสัมผัส เส้นสีเขียว.
ขั้นตอนที่ 3: การดำเนินการ เข้าทำการเทรดเมื่อราคาสัมผัสเส้นและแสดงการปฏิเสธ (เกิดไส้เทียน).
- หยุดขาดทุน: วาง SL ของคุณไว้ด้านหลังเส้นโครงสร้าง.
- ทำกำไร: ตั้งเป้าหมายที่เส้นโครงสร้างถัดไปในทิศทางของแนวโน้ม.
เคล็ดลับมือโปรเพื่อความสำเร็จ
- กฎของกรอบเวลาที่สูงกว่า: คะแนน +2 บนกราฟ H4 หรือ D1 มีพลังมากกว่าคะแนนบนกราฟ M5 ใช้กรอบเวลาที่สูงกว่าเพื่อหาทิศทาง และกรอบเวลาที่ต่ำกว่าเพื่อหาจุดเข้า.
- กราฟที่สะอาด: หากหน้าจอดูรก ให้ไปที่การตั้งค่าและเปลี่ยน
Max Levels to Showเป็น 2 เพื่อแสดงเฉพาะ "พื้น" และ "เพดาน" ที่สำคัญที่สุด. - โซน "ศูนย์": เมื่อคะแนนเป็น 0 ตลาดกำลัง "คำนวณใหม่" นี่คือเวลาที่ดีที่สุดในการทำกำไรจากการเทรดก่อนหน้าและรอการเบรกเอาท์ใหม่.
การแก้ไขปัญหา
- ไม่มีเส้นปรากฏ? ตรวจสอบว่าคุณโหลดประวัติบนกราฟเพียงพอหรือไม่ ตัวชี้วัดต้องการอย่างน้อย 100-200 แท่งเพื่อคำนวณ ATR และระดับสวิง.
- ตัวชี้วัดหน่วง? หากคอมพิวเตอร์ของคุณช้า ให้ลดการตั้งค่า
Max Historical Linesเป็น 200 เพื่อเคลียร์หน่วยความจำเร็วขึ้น.
คำถามที่พบบ่อย (FAQ)
ถาม: ตัวชี้วัดนี้มีการรีเพนท์หรือไม่?
ตอบ: ไม่ ระดับและคะแนนถูกคำนวณจาก การปิดแท่งเทียนที่ยืนยันแล้ว เมื่อระดับถูกทำลายหรือคะแนนเปลี่ยนแปลงที่การปิดแท่งเทียน จะถูกล็อกไว้ในประวัติ.
ถาม: กรอบเวลาใดดีที่สุด?
ตอบ: ตรรกะนี้ใช้ได้ทั่วไป อย่างไรก็ตาม เทรดเดอร์มืออาชีพส่วนใหญ่ใช้บนกราฟ H1, H4 หรือรายวัน เพื่อระบุ "โครงสร้างสถาบัน" หากคุณสแคปบน M1 หรือ M5 คาดว่าจะมีการเปลี่ยนคะแนนบ่อยขึ้น.
ถาม: ฉันสามารถใช้ตัวชี้วัดนี้ร่วมกับตัวชี้วัดอื่นได้หรือไม่?
ตอบ: ได้! มันทำงานได้อย่างสมบูรณ์แบบในฐานะ "ตัวกรองทิศทาง" เช่น ให้สัญญาณ RSI ที่ขายเกินเมื่อ คะแนนแนวโน้ม เป็น +2.
ขอให้เทรดอย่างมีความสุข!
ไม่ใช่คำแนะนำทางการเงิน. ตัวชี้วัด Trend Bias Structure เป็นเครื่องมือวิเคราะห์ทางเทคนิคที่ออกแบบมาเพื่อช่วยเทรดเดอร์ในการระบุโครงสร้างตลาดและแนวโน้ม.
สรุป
Key features include:
- Smart Structure Mapping: Automatically detects significant support and resistance levels filtered by ATR-based volatility.
- SGE Scoring Engine: Calculates trend strength by counting breached structural levels.
- Anti-Clutter Display: Shows only the three closest relevant levels to maintain chart clarity.
- Momentum Detection: Uses "Big Candle" logic to highlight moves with institutional backing.
- Customizable sensitivity for different assets such as XAUUSD, EURUSD, GBPUSD, and indices.
The indicator works on all timeframes from 1 minute to monthly, with professional traders typically using H1, H4, or daily charts to identify institutional structure. The dashboard provides a clear bias score and structural levels to guide trade entries and exits. Users are advised to trade with the bias, waiting for price pullbacks to the nearest structure lines before executing trades.
This tool is intended as a directional filter and can be combined with other indicators like RSI. It does not repaint, as calculations are based on confirmed candle closes.
รีวิวจากลูกค้า
5 | 100 % | |
4 | 0 % | |
3 | 0 % | |
2 | 0 % | |
1 | 0 % |